Map Tools
- Print
- DarkLight
- PDF
Map Tools
- Print
- DarkLight
- PDF
Article summary
Did you find this summary helpful?
Thank you for your feedback!
Description
Standard Map tools are available for every object in the Research Project workflow.
Overview
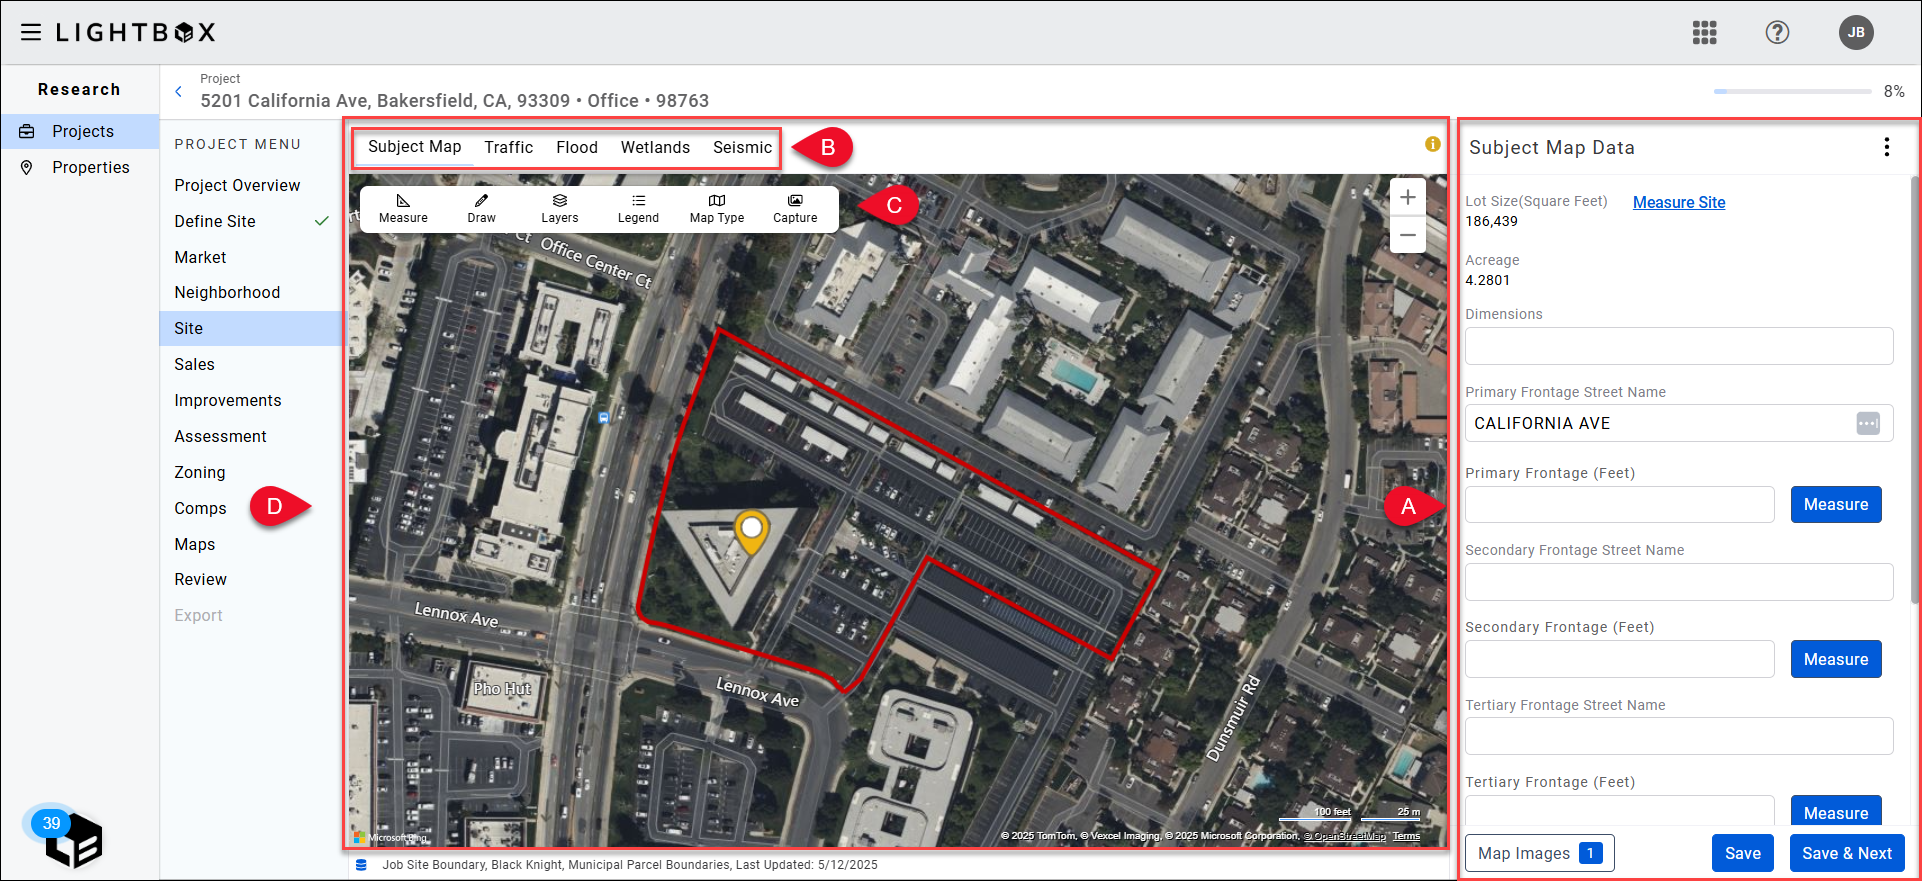
A. Data/Data Entry Panel: Some exhibits, such as the Subject Map, include blank fields in which you can record values. Others provide data for the selected exhibit but do not allow for data entry. This panel also contains buttons for changing the map display to Streetside or Bird’s Eye View and adding the Primary Frontage and Secondary Frontage values.
B. Exhibits Bar: Select an exhibit to open the associated map. Exhibits include Subject Map, Flood, Wetlands, Seismic, Market Boundaries, Traffic, School, and Custom. Refer to Projects - Maps (Exhibits) for more information.
C. Toolbar: Contains tools that allow you to view, manipulate, and interpret the map and map data. The Measure, Draw, and Map Type toolsets are consistent across map exhibits; the toolsets found under the Layers, Legend, Map Type, and Capture tools reflect the exhibit selected. Example: “County Boundaries” is available in the Layers tool for the Market Boundaries exhibit, but not the Subject Map exhibit.
D. Map: The exhibit selected, along with any markup added by the user.
Data/Data Entry Panel
Click the three dots in the upper right corner to expose a menu containing two commands: View Streetside and View Bird’s Eye.
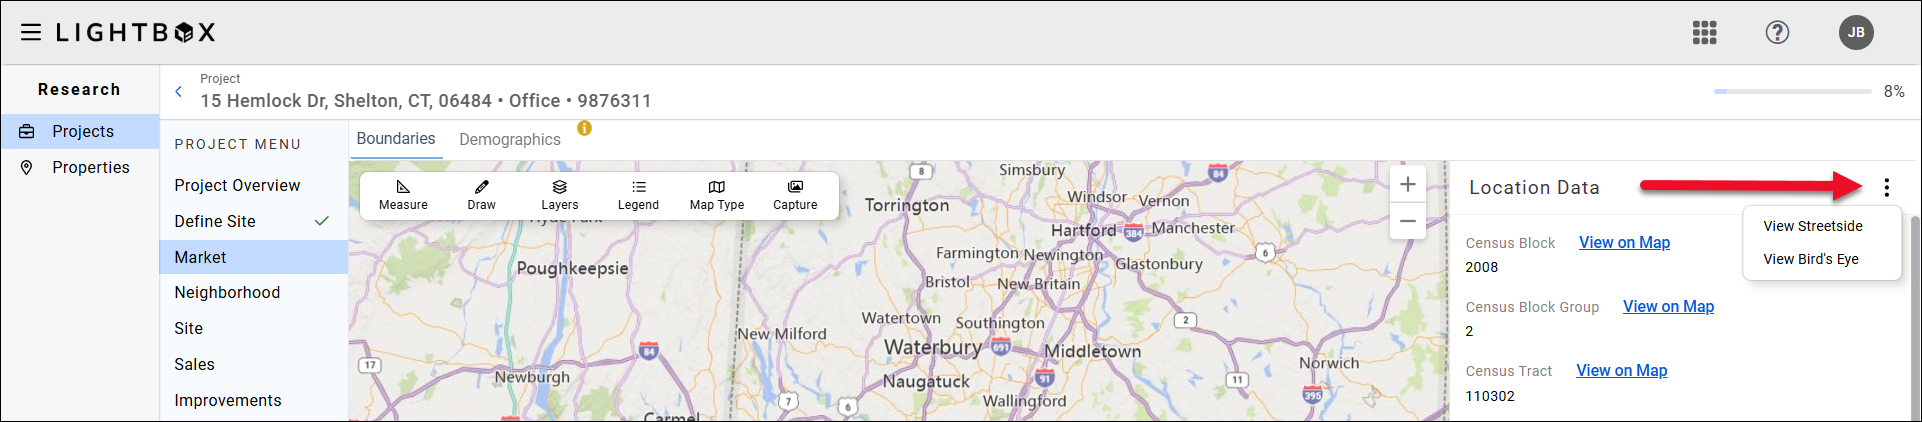
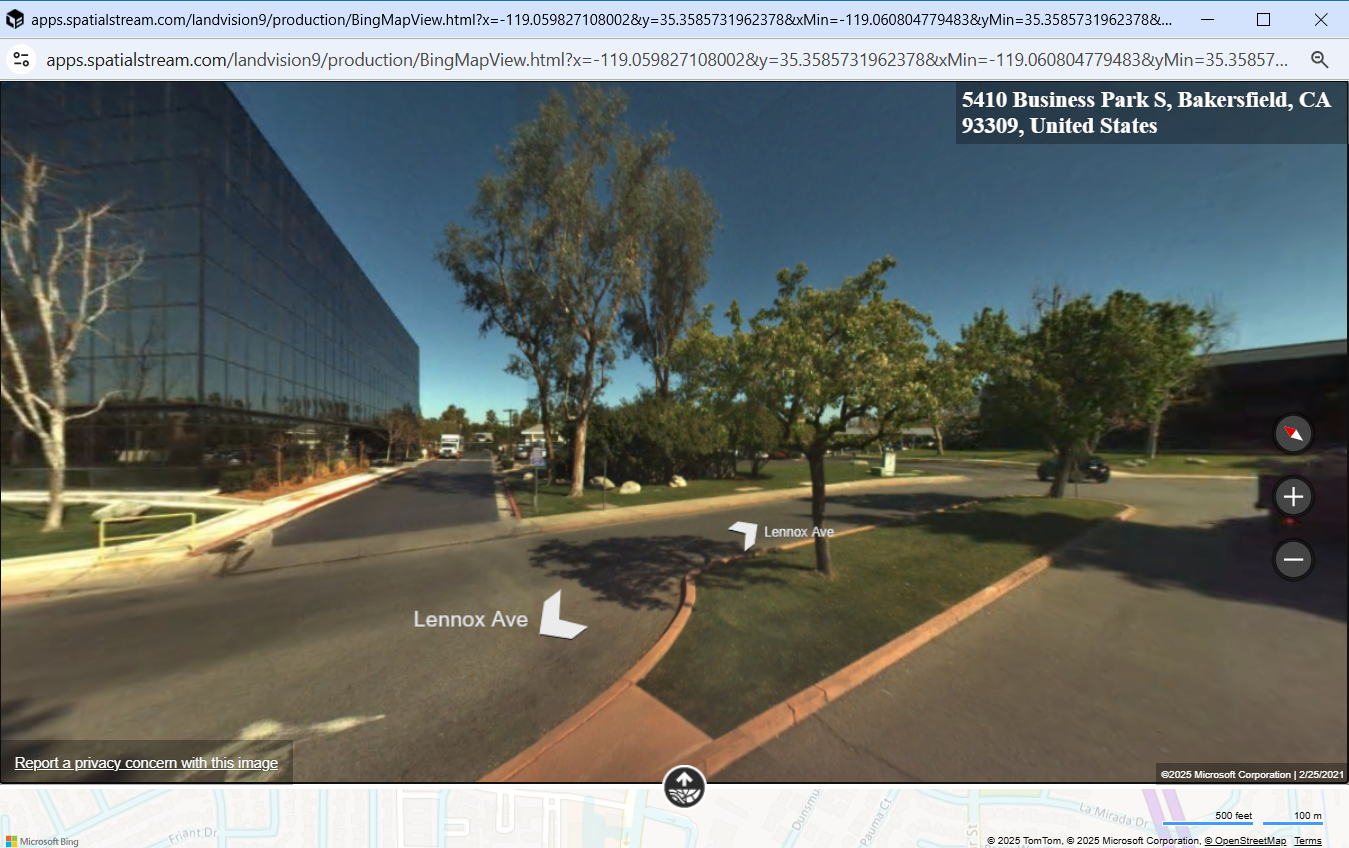
Click View Streetside to display a streetside view of the site. A new browser window opens, displaying the site from an adjacent street.

A. Click to orient the view towards the north.
B. Click the plus/minus icons to zoom in and zoom out.
C. Click an arrow to proceed down the street in that direction.
D. Click to expand a panel showing the current location on the map. Click and drag the orange diamond in the expanded panel to move the street view to a new location.
Click anywhere on the street view image (top panel) and drag your mouse to change the direction in which the view is facing.

Initial View
Expanded view (item D)
Click View Bird’s Eye to display a bird’s eye view of the site. A new browser window will open, displaying the site.

A. Click the arrows on either side of the compass icon to flip the camera orientation.
B. Click the plus/minus icons to zoom in and zoom out.
C. Click the X icon to close the bird’s eye view browser window.
D. Click Labels to toggle labels on/off. Labels include street names, building names, and other basic information.
Click anywhere on the map and drag your mouse to reorient the view.
Click the Measure button next to Primary Frontage or Secondary Frontage to measure the respective frontage. A tooltip will appear at the top of the page and provide instructions.
Toolbar
Measure
Measure via a polygon, line, or circle. Left-click to begin the measurement. Double click to end the measurement.
.png "proj_site_02(1).png")
Click Measure Polygon in the Measure menu.
Click a location on the map to begin the measurement. Drag your mouse to the first point at which you need to change direction and then click again to add a vertex. Double click to complete the polygon.
The length is displayed in a white text box.
.png")
Click Measure Line in the Measure menu. Click the desired starting location on the map to begin the measurement, then drag your mouse to the desired ending location. Double click to complete the line.
The length is displayed in a white text box.
.png")
Click Measure Circle in the Measure menu.
Click a location on the map to begin the measurement. This spot will form the center of the circle. Drag the mouse to increase/decrease the size of the circle. Double click to complete the circle.
The circumference, radius, and area are displayed in a white text box.
.png")
Draw
The Draw tools allow you to add shapes, labels, and icons to the map.
.png")
Click Draw Polygon in the Draw menu.
Click a location on the map to begin the measurement. Drag your mouse to the first point at which you need to change direction and then click again to add a vertex. When the ending location of the polygon meets the beginning, the polygon will be highlighted.
Click and drag one of the small, blue boxes to adjust the location of that point in the polygon.
The stroke color, fill color, stroke style, and stroke width can be customized in the menu that appears on the right side of the map.
.png")
Click Draw Line in the Draw menu.
Click the desired starting location on the map to begin drawing the line, then drag your mouse to desired ending location. Double click to complete the line.
Click and drag one of the small, blue boxes to adjust the location of that point on the line.
The stroke color, stroke style, and stroke width can be customized in the menu that appears on the right side of the map.
.png")
Click Draw Circle in the Draw menu.
Click a location on the map to place the center of the circle. Click and drag the small, blue box on the outside of the circle to increase/decrease the size of the circle.
Click and drag the blue box in the center of the circle to move the circle and/or resize the circle.
The stroke color, fill color, stroke style, and stroke width can be customized in the menu that appears on the right side of the map.
.png")
Click Draw Rectangle in the Draw menu.
Click a location on the map to place one corner of the rectangle. Drag the cursor to another location and click to finalize the placement of the rectangle.
Click one of the small, blue squares found in the corners of the rectangle to resize the rectangle.
The stroke color, fill color, stroke style, and stroke width can be customized in the menu that appears on the right side of the map.
.png")
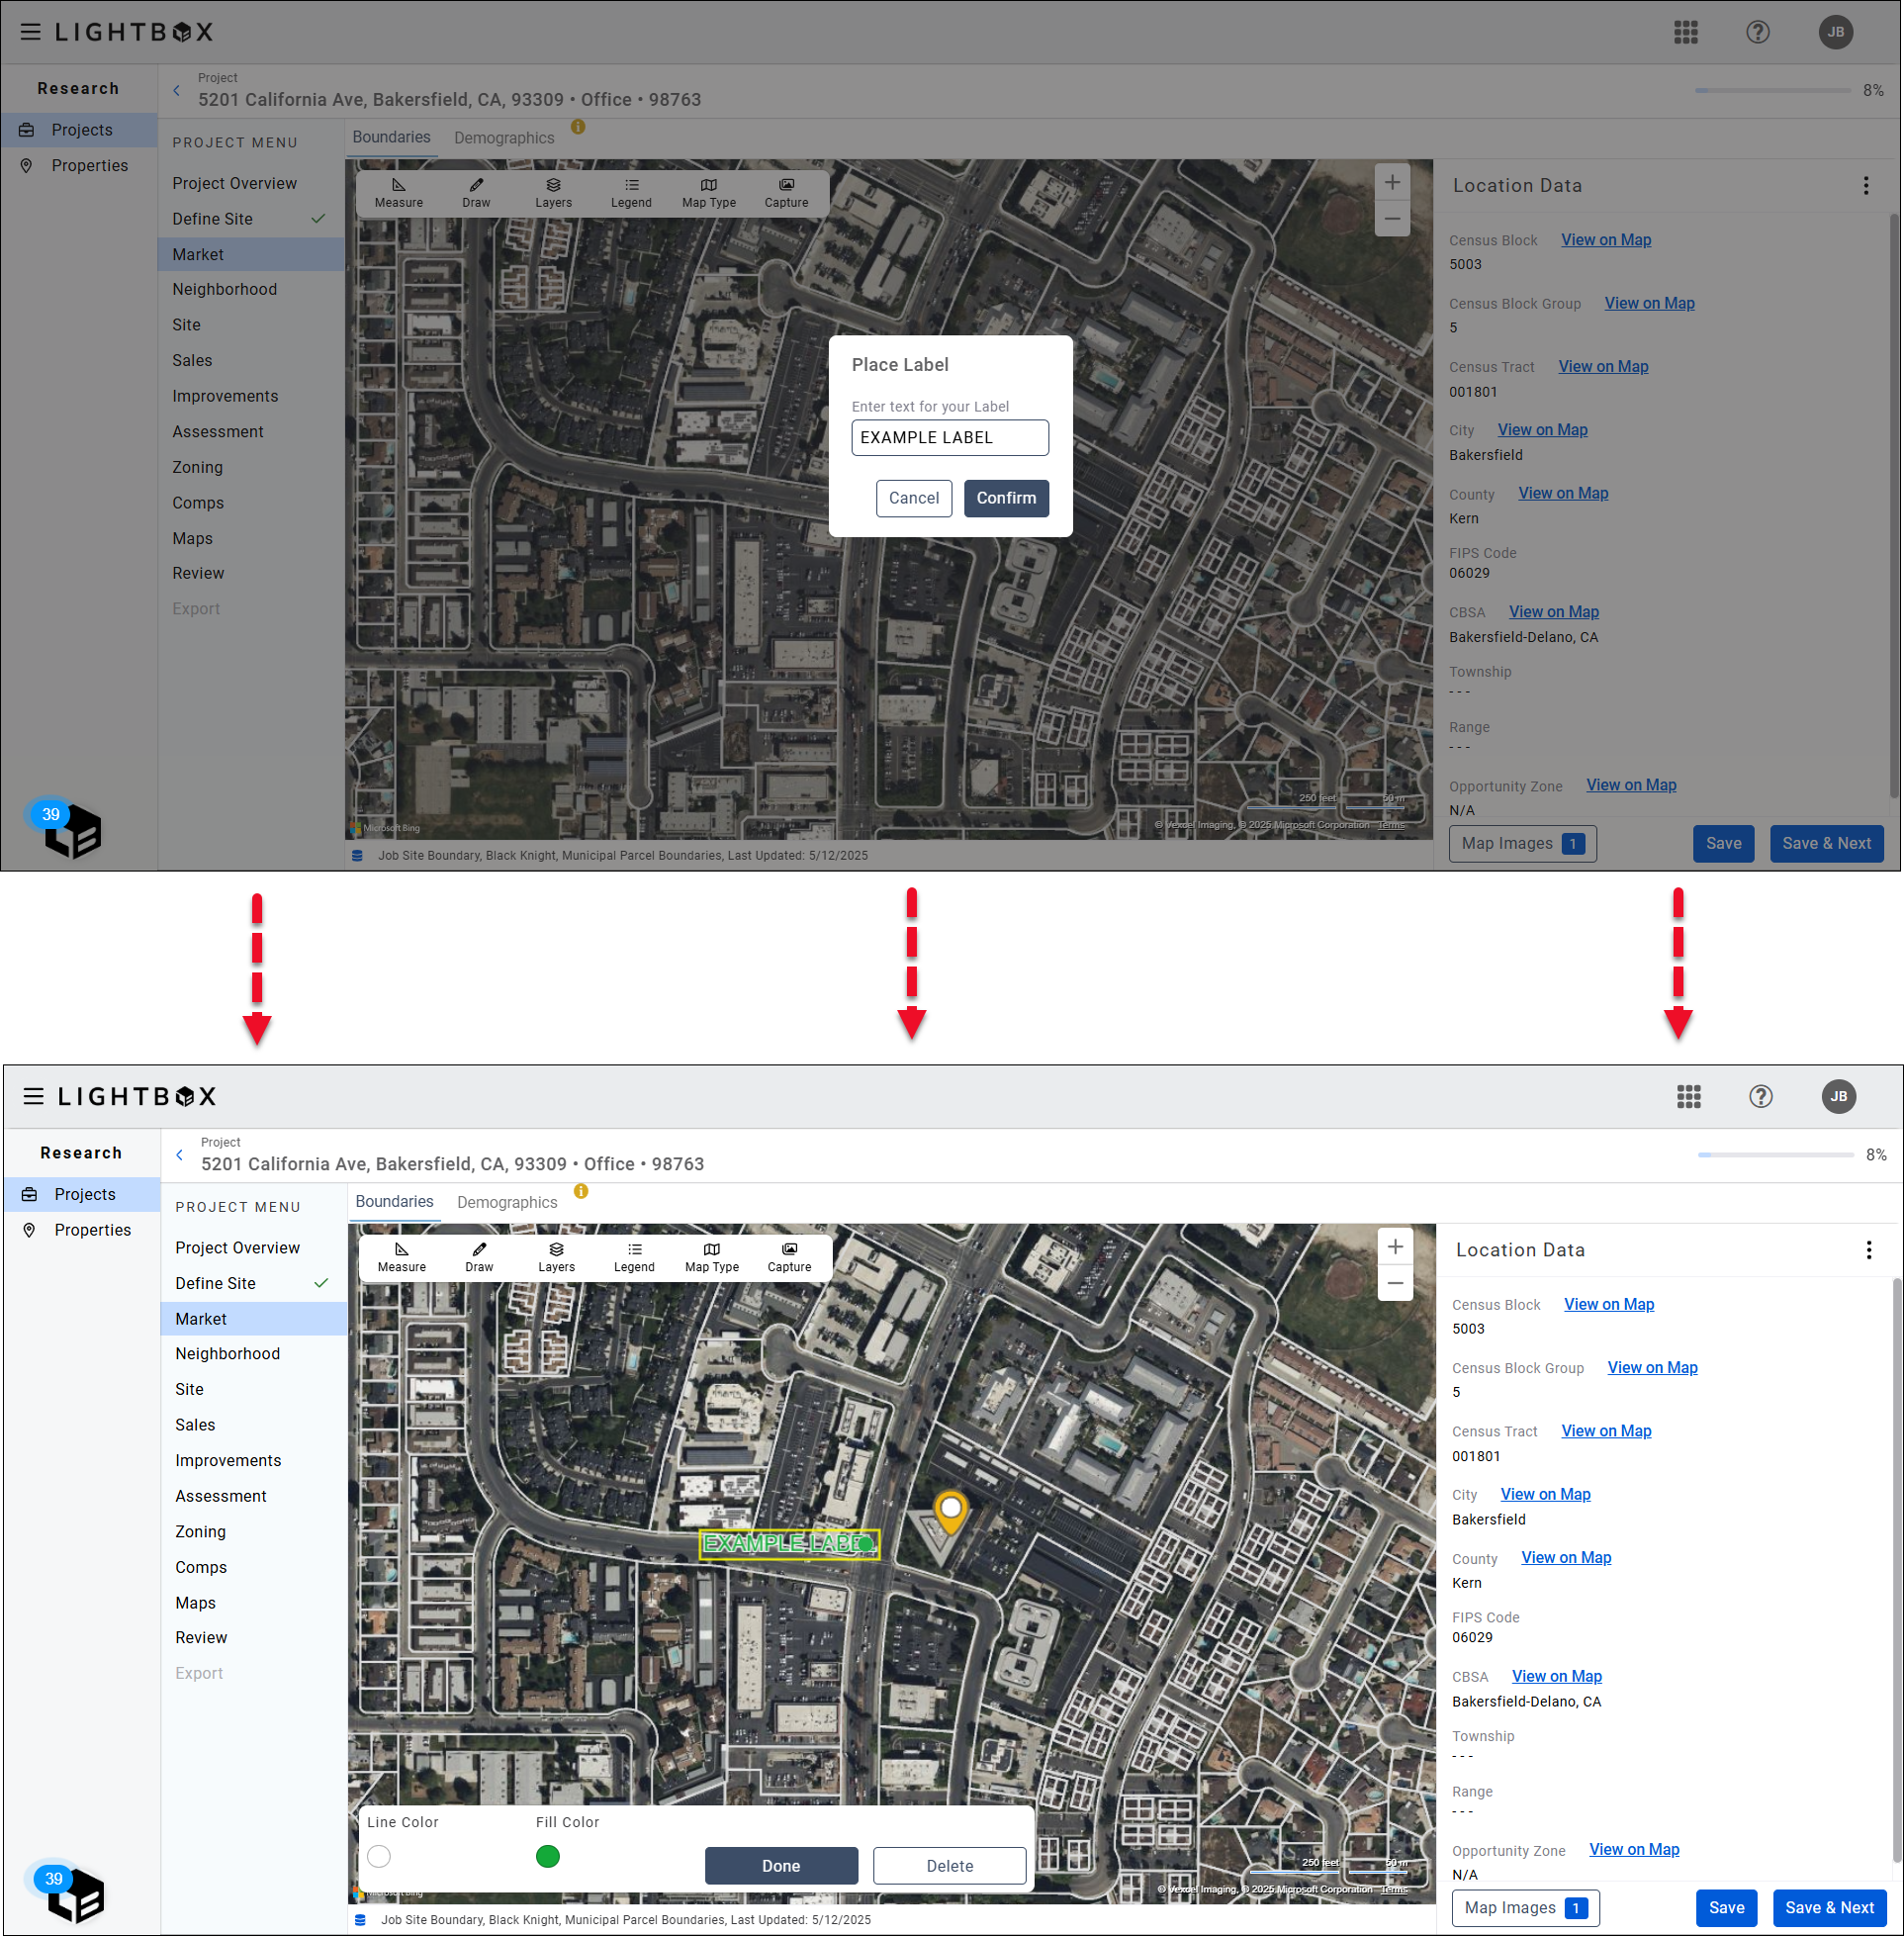
Click Place Label in the Draw menu. A pop-up will open; enter your desired label text and click Confirm.
Place the label in the desired location on the map. To move the label again, click inside the label box and drag the label to the desired location. To adjust the angle of the label, click the small, green circle to the right of the label and drag your mouse up or down.
The stroke color and fill color can be customized in the menu that appears on the right side of the map.
Click Place Icon in the Draw menu. Click a location on the map to place the icon. Once placed, you can click and drag the icon to move it to a different location.
Click the small circle to the right of the icon to rotate the icon.
The fill color can be customized in the menu that appears on the right side of the map.
.png")
Click Clear Drawings in the Draw menu. A pop-up will request confirmation. Click Continue to delete all drawings.
NOTE:
If you have a drawing selected when you have click Clear Drawings, that drawing will not be deleted.
.png")
Layers
Users are provided with map layers to visualize data attributes. Click Layers and check/uncheck boxes to display/hide layers.
NOTE:
The layers available are specific to the exhibit selected. For example, the Site exhibit has different layers than the Market exhibit.
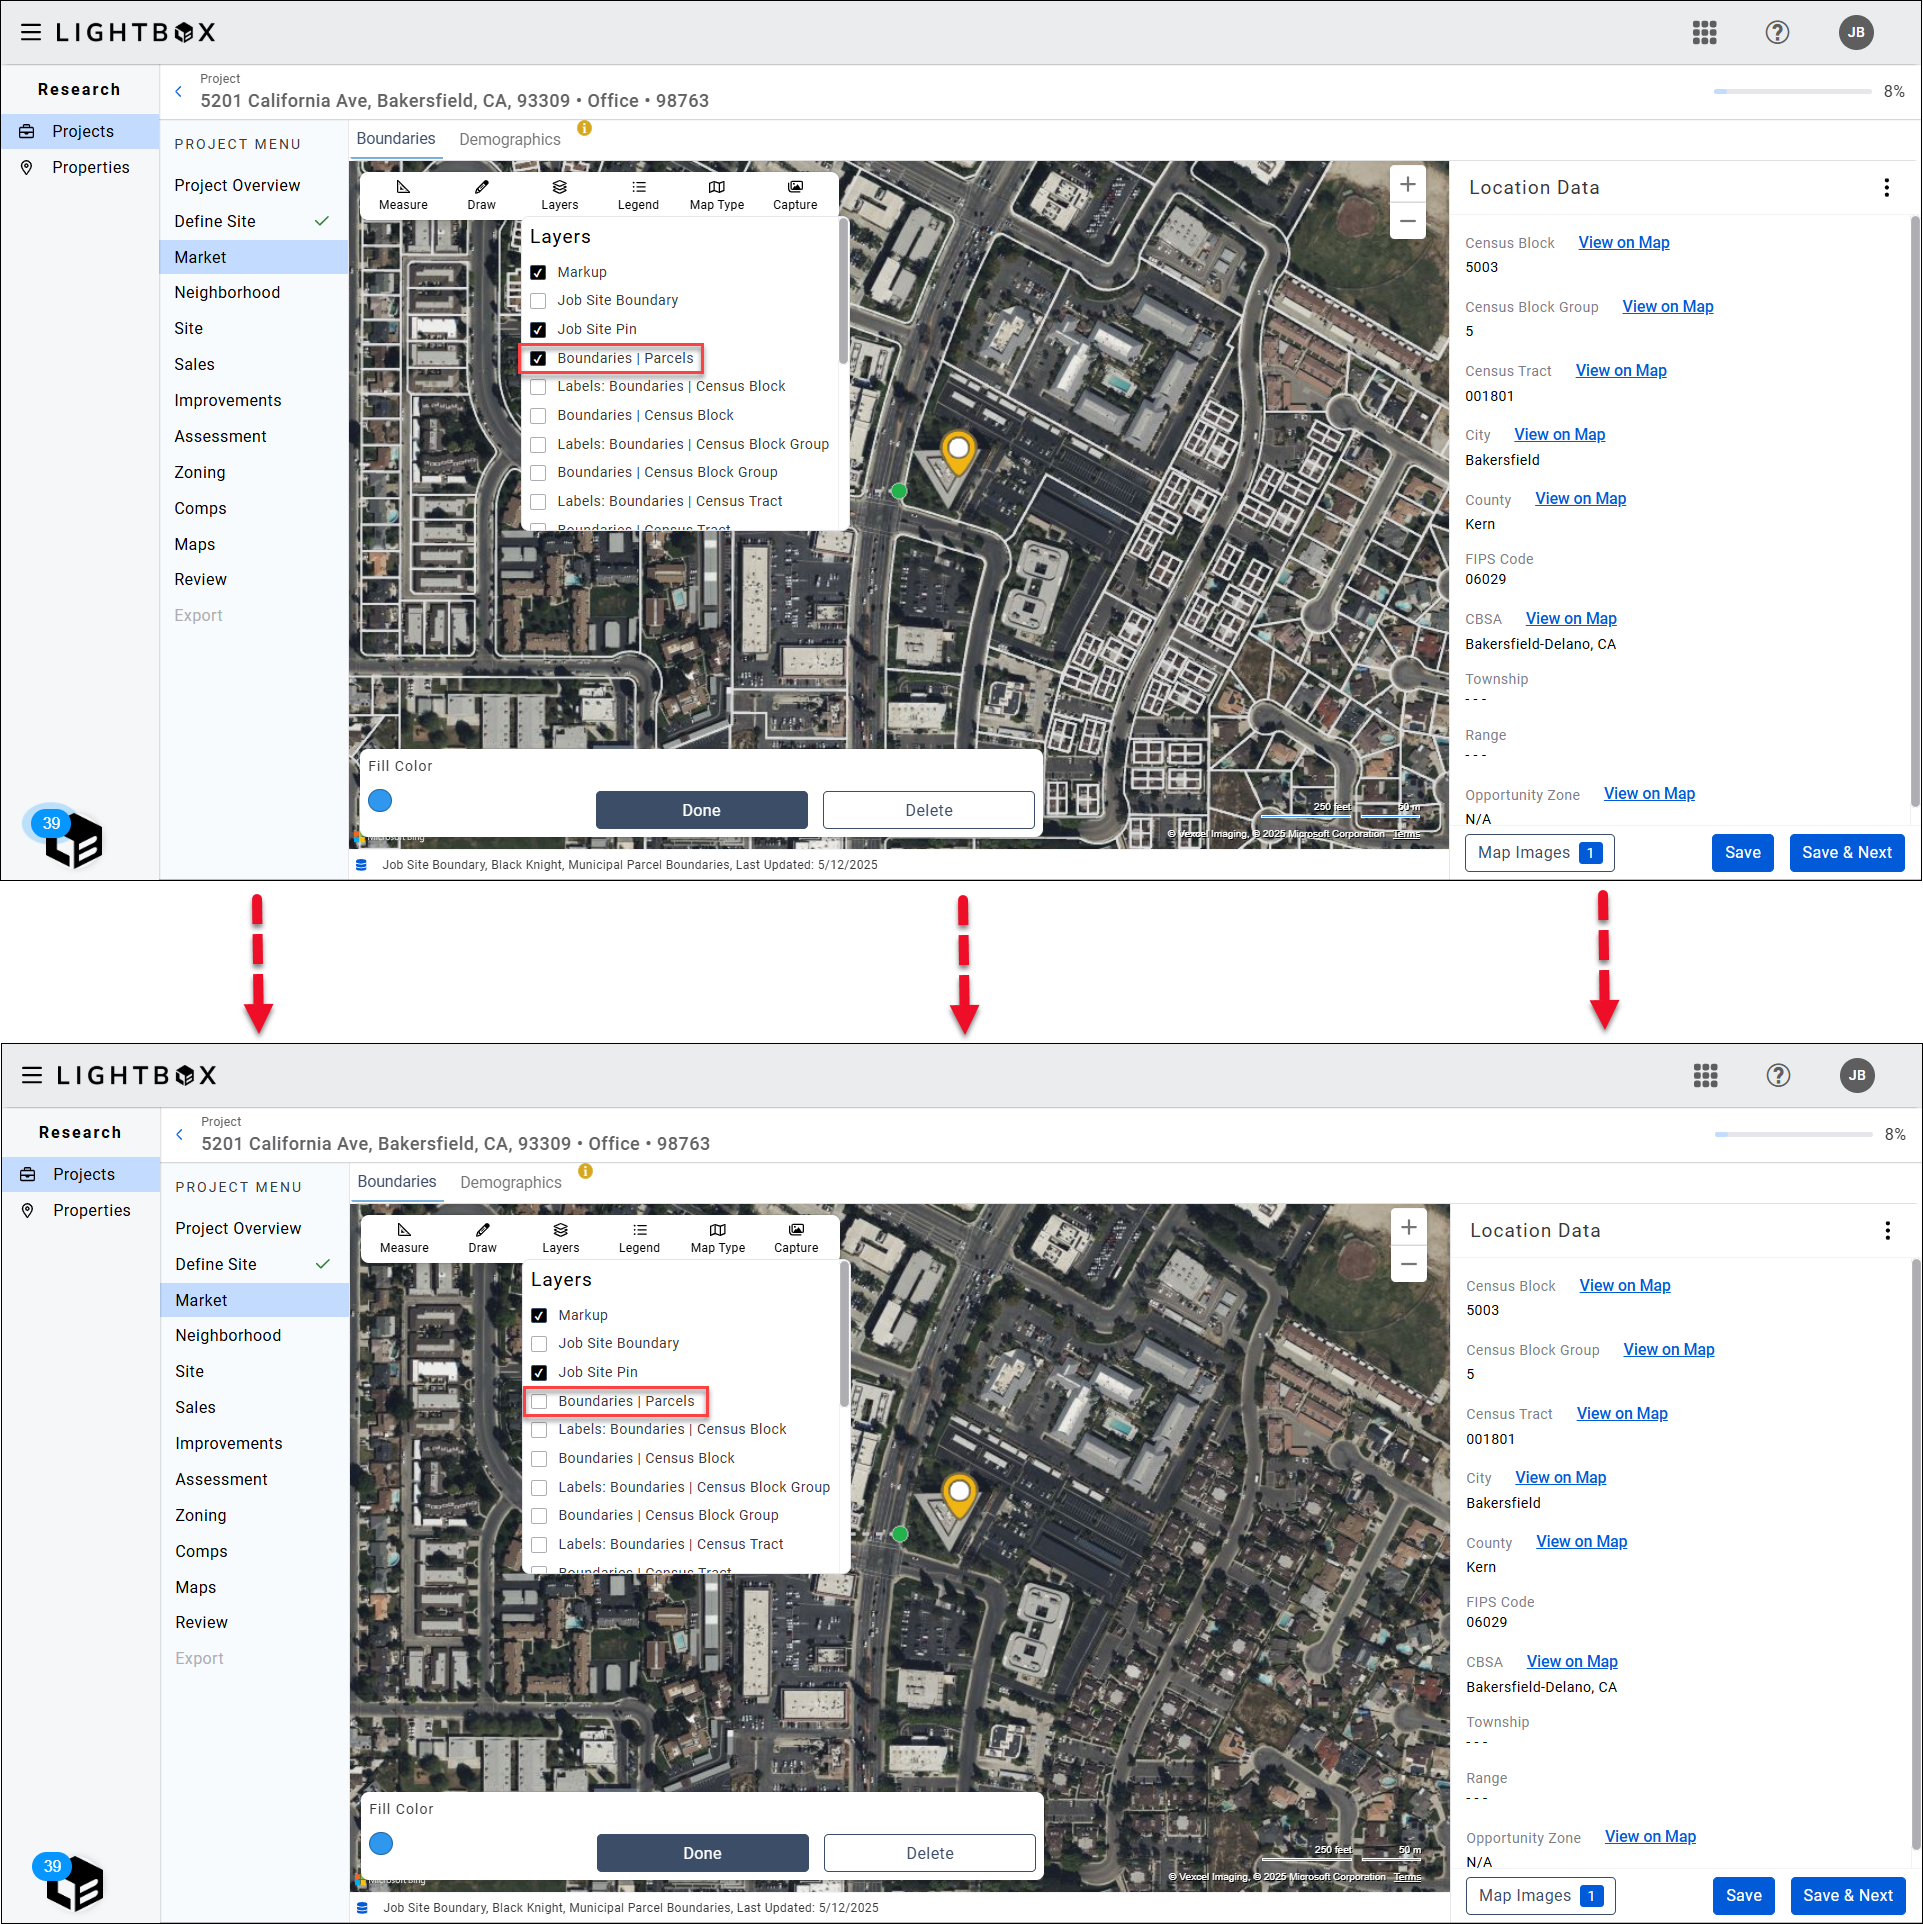
In the first image above, the Boundaries | Parcels layer is active. In the second image, it is not active.
Legend
Users are provided with Layer legends for contextualization. Click Legend to view the legend for the selected exhibit.
.png")
Map Type
Users can choose what type of map to display.
Options include Road, Aerial, Aerial with Label, and Topography. The example to the right is the Road map.
.png")
Aerial map example.
.png")
Aerial with Label map example.
.png")
Topography map example.
.png")
Capture
Users are provided with options for exporting their map exhibit.
Full Page: Sizes the map to a portrait, full page.
Half Page: Sizes the map to a portrait, half page. This is the default option.
Quarter Page: Sizes the map to a portrait, quarter page.
Legend Capture: Allows for an export of the default layer for the specific map once a map size has been chosen. Some maps do not have a default layer and therefore a legend export is not available.
.png")
You can save up to three maps for each exhibit (Subject, Wetlands, Flood, etc.). Click the drop-down menu at the top of the modal and select one of the three available image names, then click Save Map.
If you select an image name that is in use, a pop-up will ask you to confirm whether you want to overwrite the existing image. Click Replace Saved Map to overwrite the existing saved map image with the new capture.
NOTE:
LightBox Valuation automatically captures a default image for each exhibit, with the exception of Custom.
Manage map images by clicking the Map Images button in the lower right corner of the page.
.png")
The Map Images modal opens.
.png")
Click on a map image to expand that image. Click the trash can icon below a map image to delete that image.
NOTE:
Confirmation is not required to delete; the image will be deleted immediately. Default images cannot be deleted.
Click Done to close the modal.
Images are managed separately for each exhibit. Example: When the Flood exhibit is selected, only images captured in the Flood exhibit will be displayed in Map Images. This includes the default image automatically captured for that exhibit.
Was this article helpful?