Research Center Module
- Print
- DarkLight
- PDF
Research Center Module
- Print
- DarkLight
- PDF
Article summary
Did you find this summary helpful?
Thank you for your feedback!
The Research Center module is Insights' most flexible query tool, allowing the user to perform in-depth market analysis with LightBox’s broadest data set across multiple time periods.
Defining Filters and Running a Report
To access the Research Center module, click on Research Center in the left-hand navigation bar. When you first open the Research Center module, the LightBox RC Default filter will be selected. You will have two different options to generate a new report: selecting from your previously saved reports or creating a new report.
Click Select Saved Report and then select a saved report to apply that set of saved filter criteria.
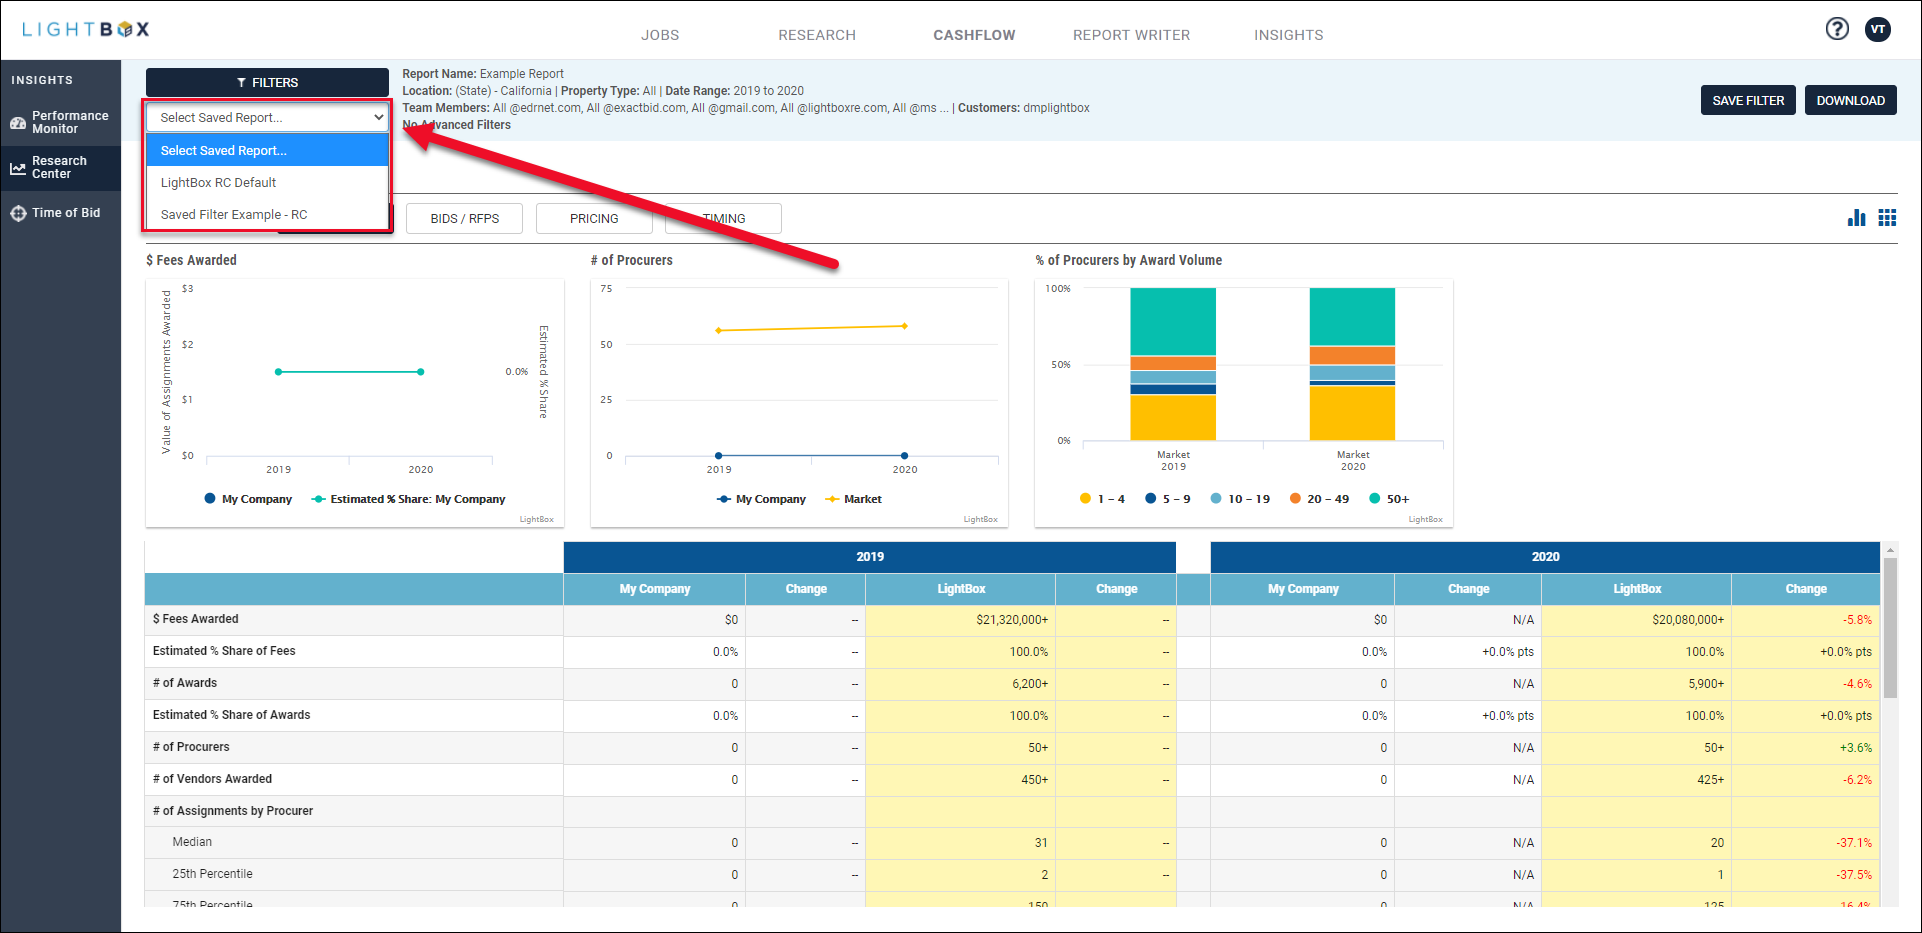
In the example above, there are two saved reports--LightBox RC Default and the user-created “Saved Filter Example - RC.”
Click Filters to define a new set of filter criteria.

The Filter Controls screen modal will open.
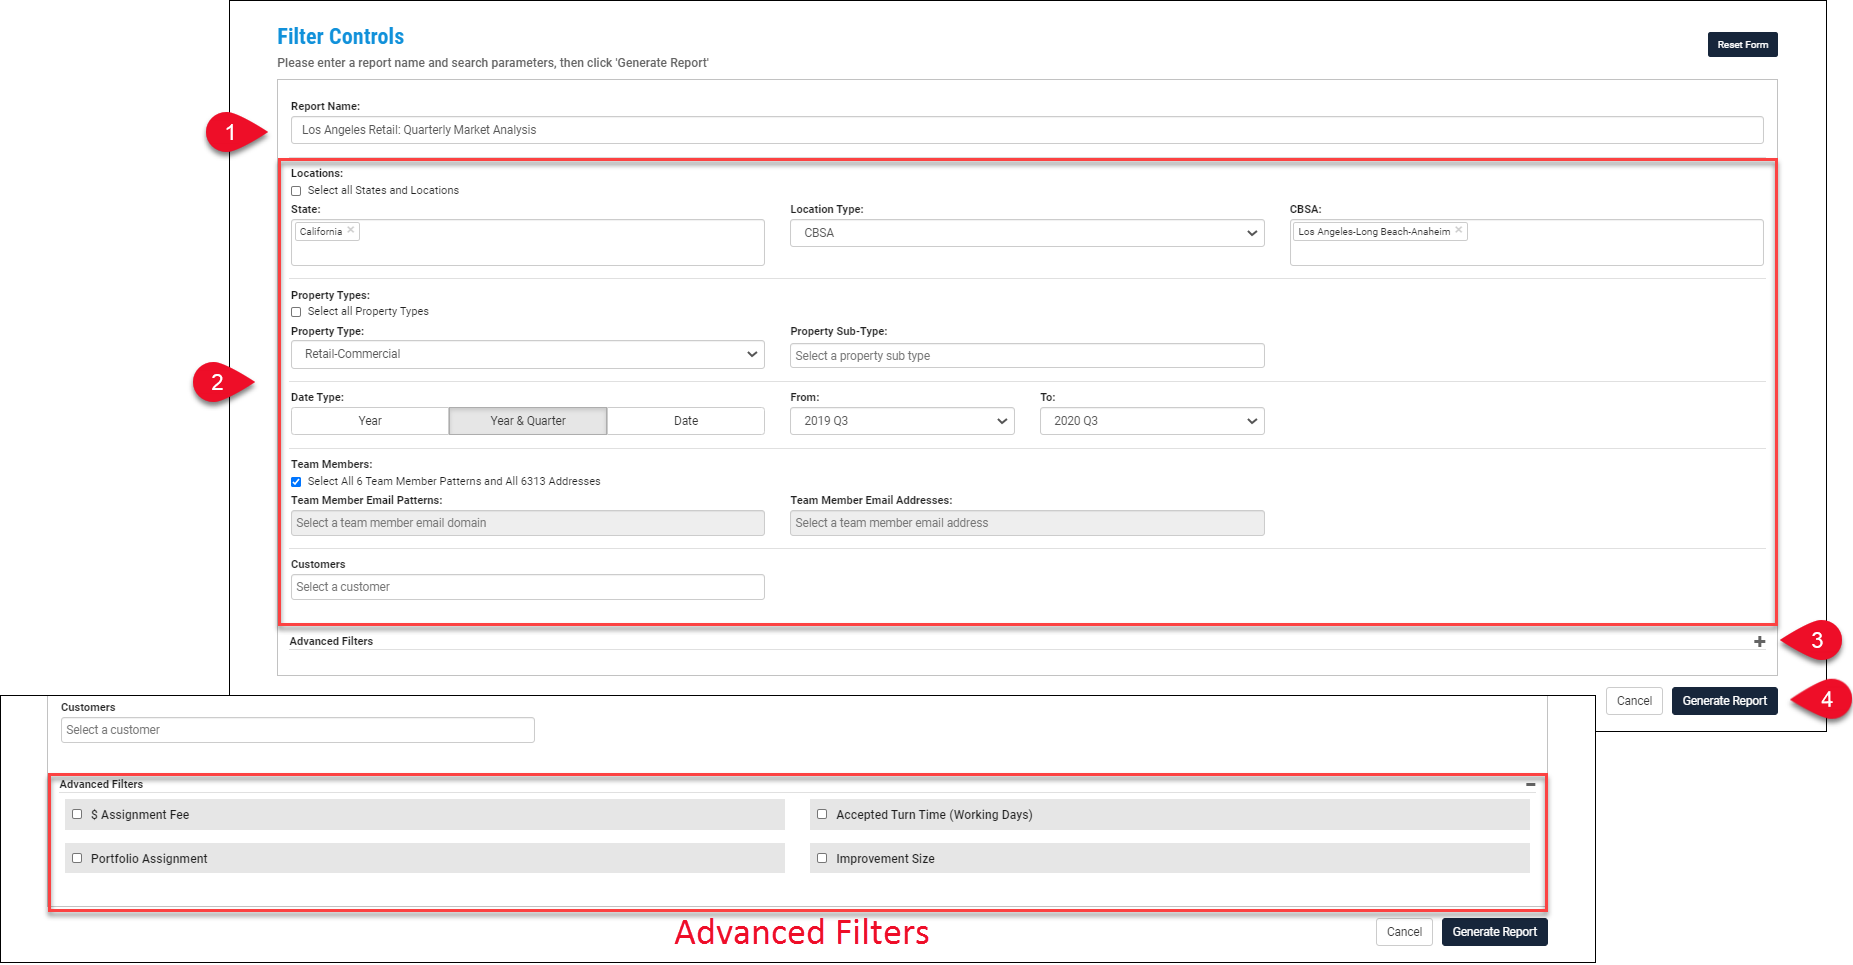
Optionally, enter a Report Name.
Define Primary filters: Locations, Property Types, Date Type, Team Members, and Customers.
Optionally, click the + icon to expose and define Advanced filters: $ Assignment Fee, Accepted Turn Time (Working Days), Portfolio Assignment, Improvement Size.
Refer to Filter Details for additional information.Click Generate Report after the filters have been defined. The Filter Controls modal will close and the report data will be presented.
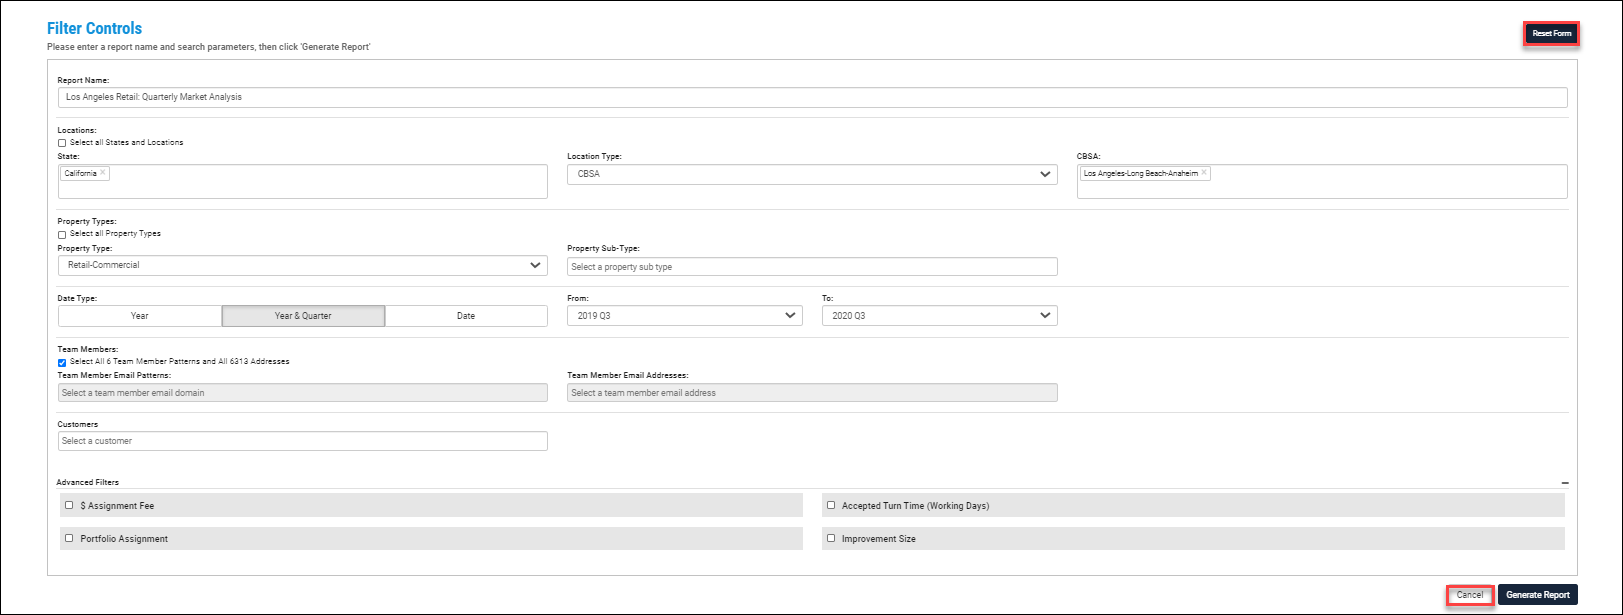
To reset all filters to their default settings, click Reset Form in the upper right corner of the modal. Click Cancel in the lower right corner to close the Filter Controls modal. If a report was generated previously, the output from that report will be displayed when the Filter Controls modal closes.
Viewing the Report
When a report is generated, the Filter Controls modal closes and the screen is populated with the data output corresponding to the user-defined filters.
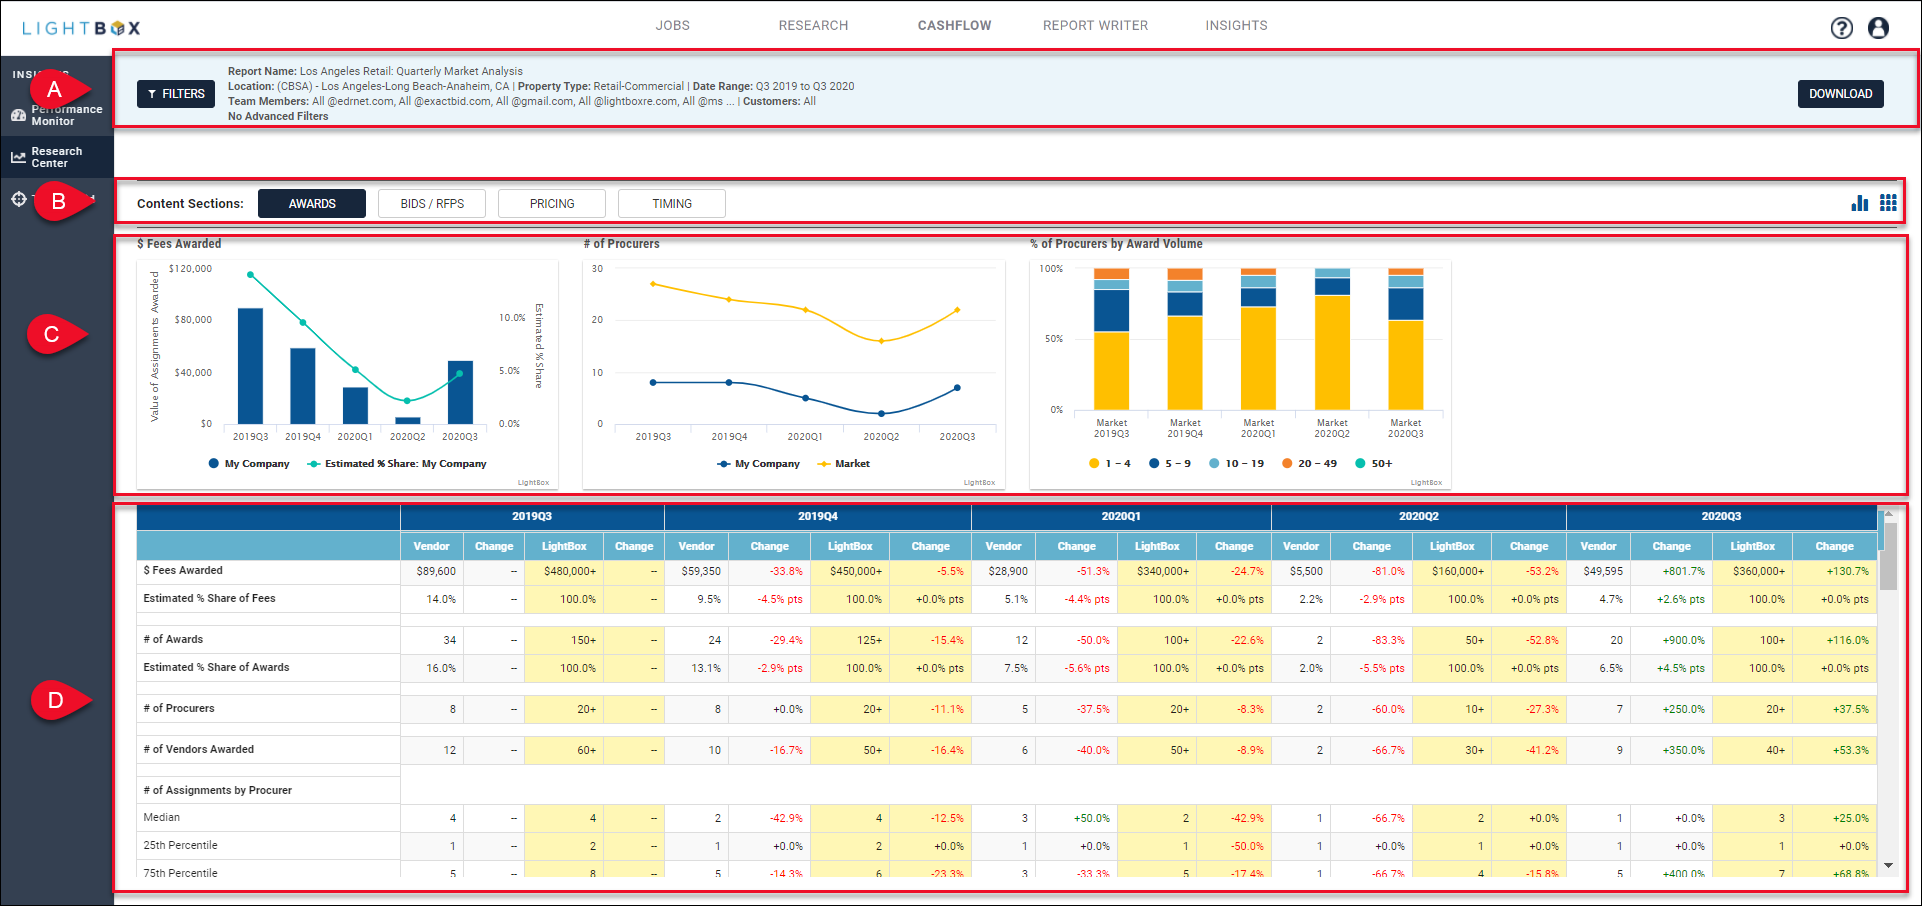
.png) The top of the output screen presents the user with summary information and two buttons:
The top of the output screen presents the user with summary information and two buttons:

The top of the output screen presents the user with summary information, three buttons, and a drop-down menu:
a. Click Filters to reopen the Filter Controls modal.
b. View report name and filter parameters.
c. Select a Saved Report.
d. Click Save Filter to create a new Saved Report.
A pop-up will appear in the upper left corner of the page.
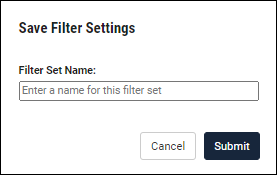
- Enter a Filter Set Name and click Submit to create a new Saved Report. Saved Reports that you create are not visible to other LightBox Valuation users. Note: Filter Set Names must be unique; attempting to create a new Saved Report with a Filter Set Name that already exists will return an error message.
NOTE:
The top section of the output is locked in place so that it will always be visible when scrolling between different data points.
.png) Output statistics are organized into categories, referred to as “Content Sections.” The default Content Section is Awards.
Output statistics are organized into categories, referred to as “Content Sections.” The default Content Section is Awards.
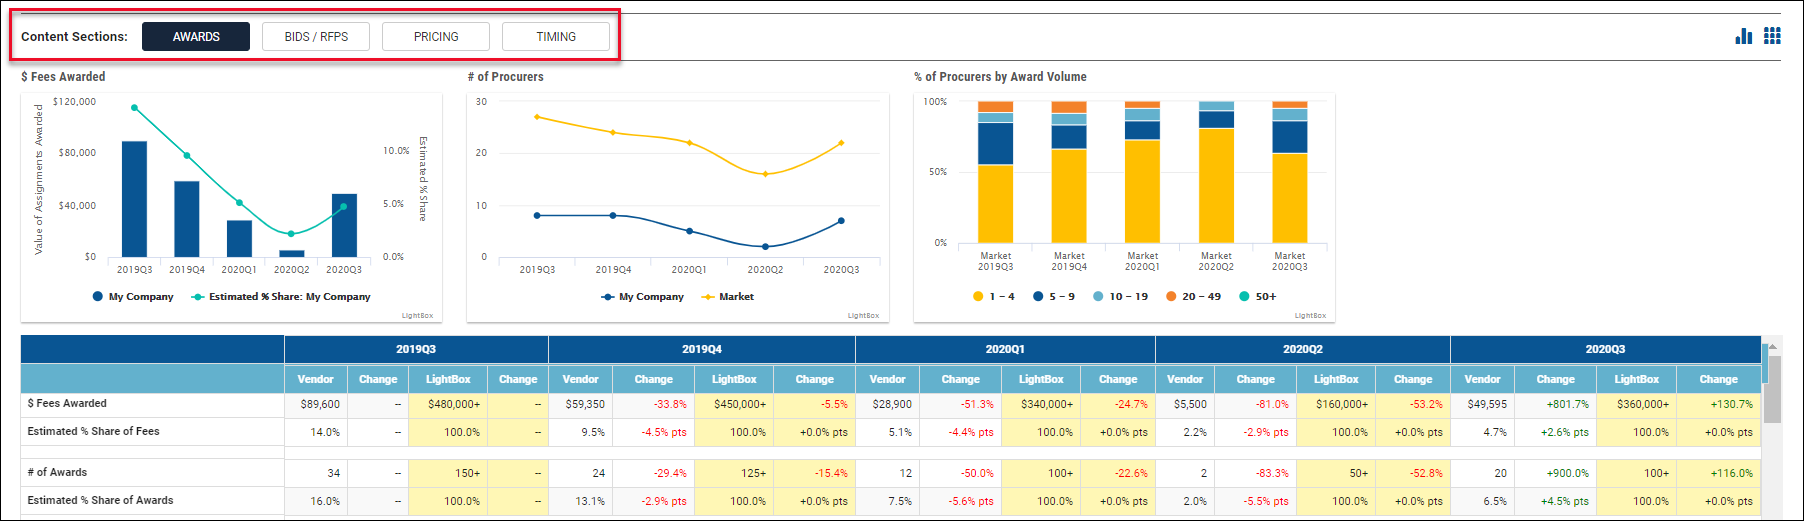
Click on a Content Section to display the corresponding charts and data table for that Content Section.
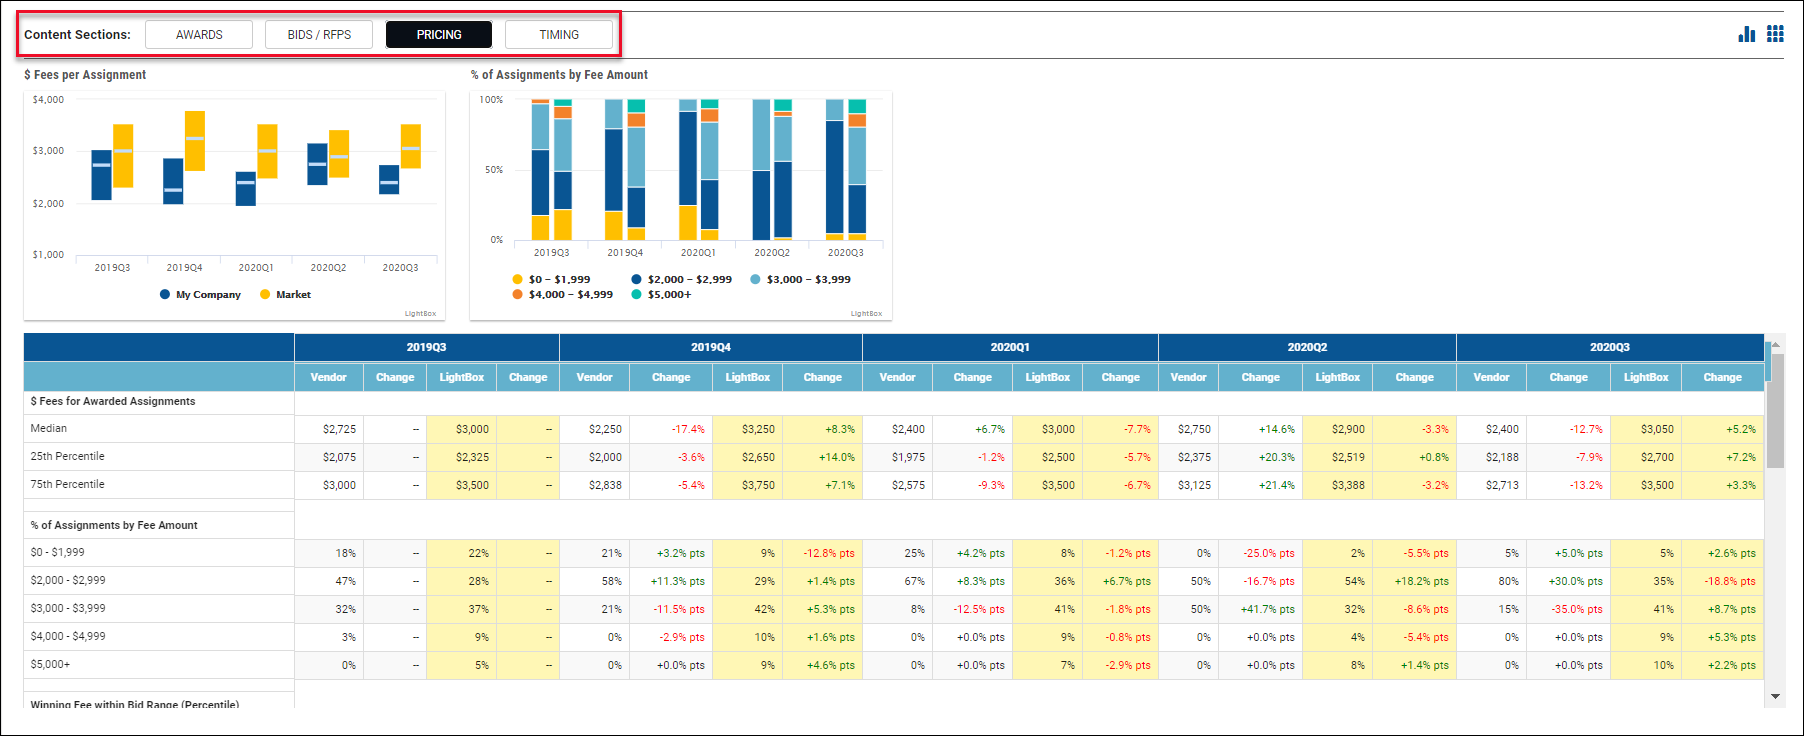
In the example above, the Pricing Content Section is selected.
Click the icons on the far right to hide/display the charts or tabular data, respectively.

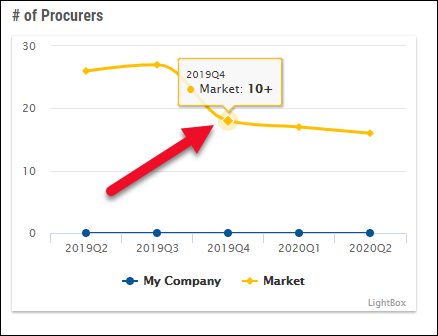
.png) Hover over a data point on a chart to display a tooltip with additional information about that data point.
Hover over a data point on a chart to display a tooltip with additional information about that data point.
.png)
The tabular data appears below the chart section and displays the selected Content Section’s data.
Note: Some datasets require scrolling to view all of the information.

Download File
You can download report information, including parameters and output statistics, in .xls format for further manipulation. The .xls document includes the following:
Report Summary Tab: Lists all report parameters.
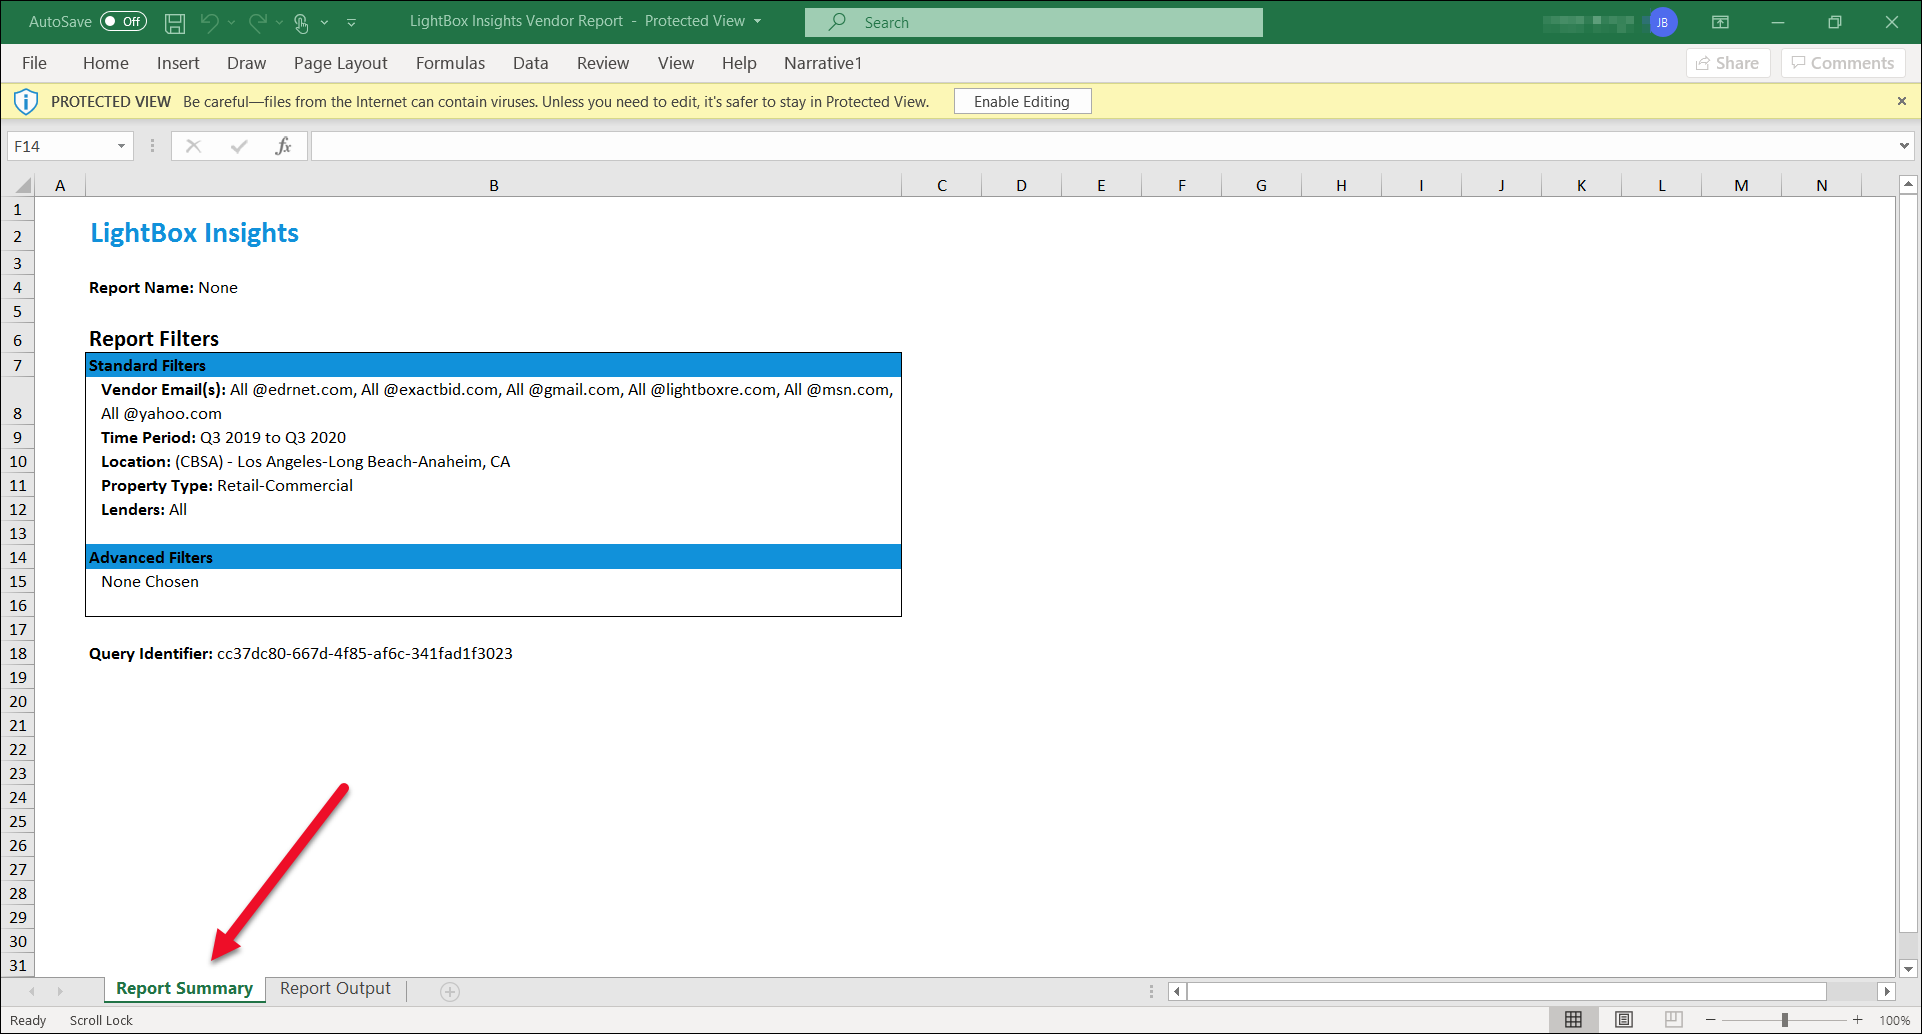
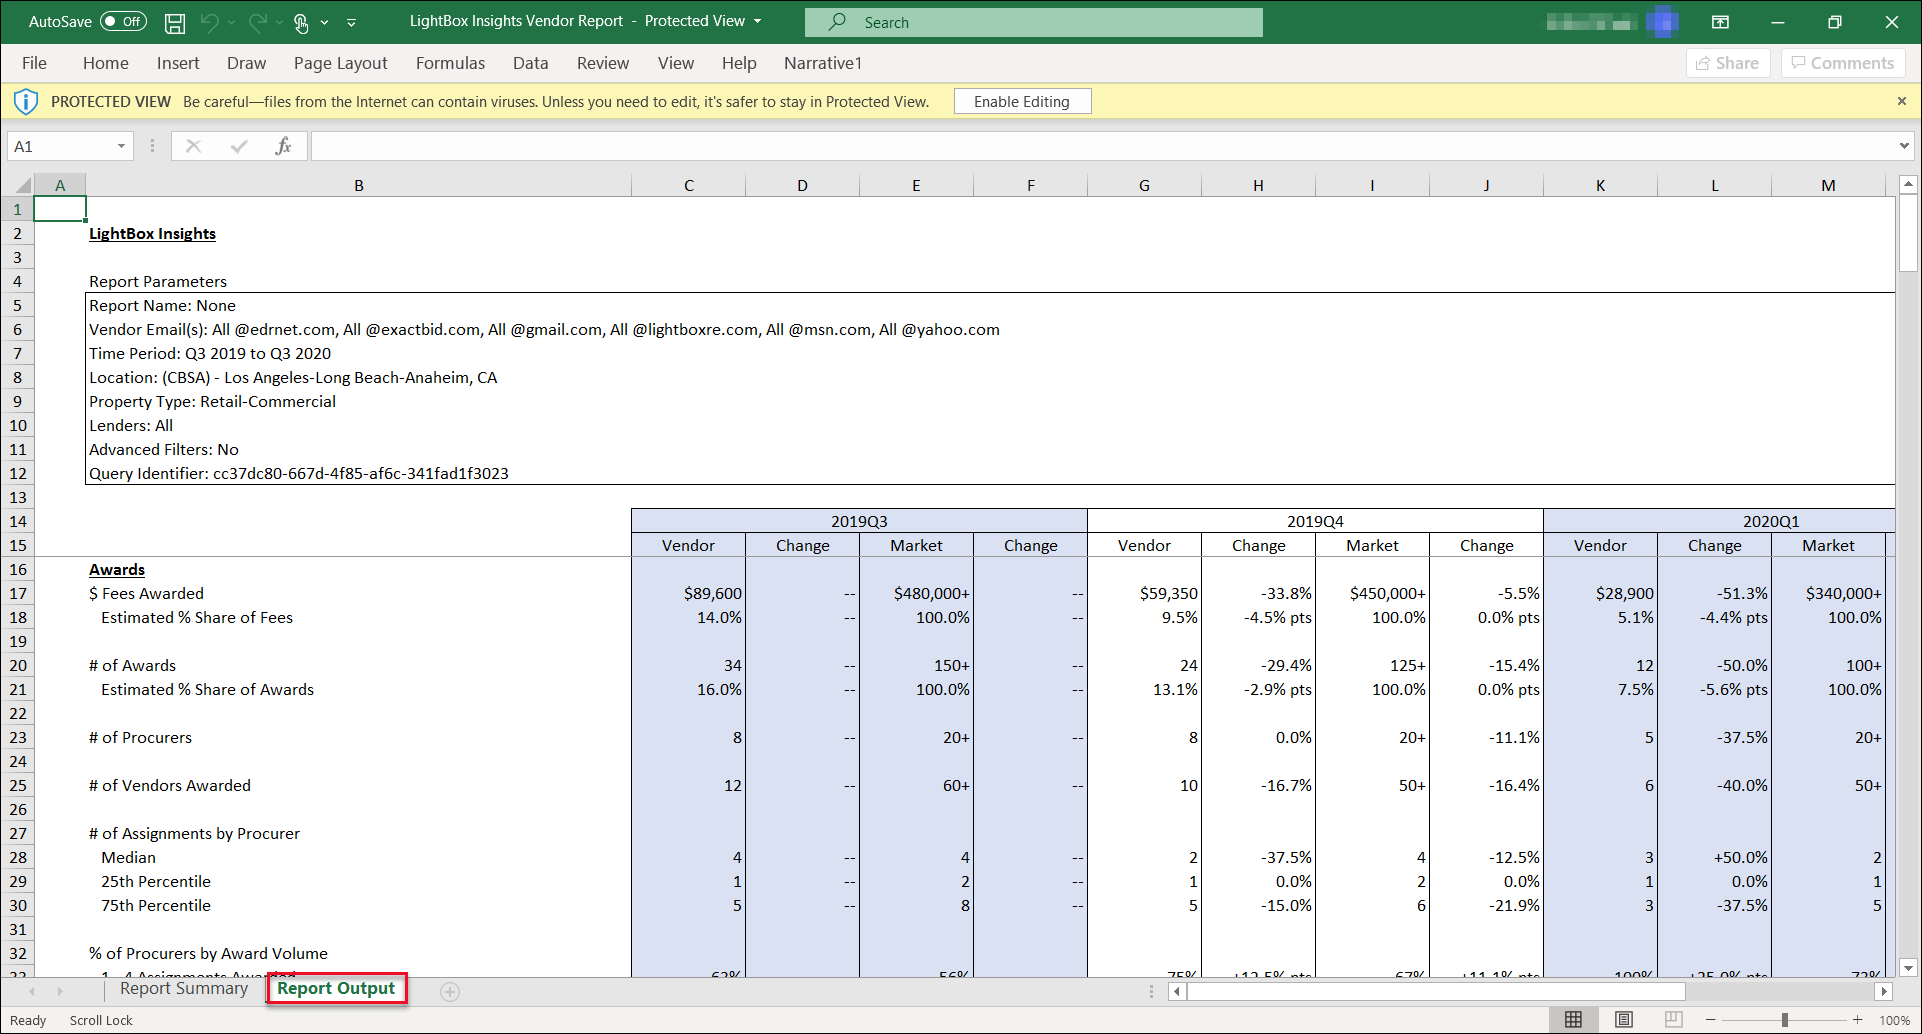
Report Output Tab: Provides a summary of report parameters along with all output statistics, grouped according to Content Sections. Note that the summary section at the top is locked in place so you will always be able to see this information when scrolling between different data points.
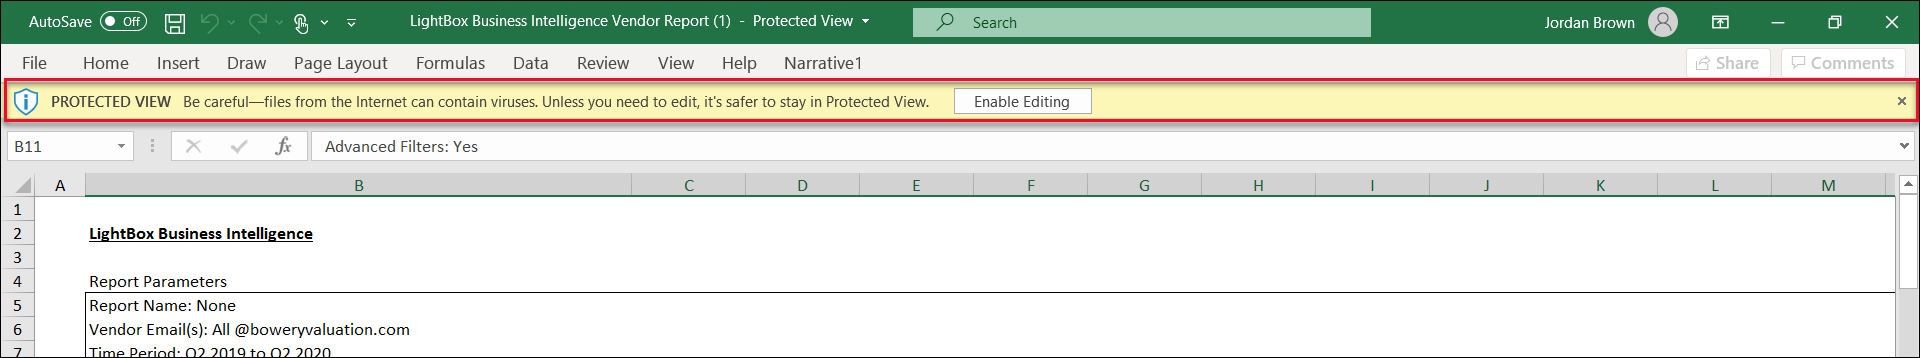
NOTE:
If the file is in Protected View, click Enable Editing in the yellow banner at the top of the Excel sheet to be able to manipulate the data.
Filter Details
Queries can be made with five primary filters and four advanced filters. Primary filters include:
- Locations
- Property Types
- Date Type
- Team Members
- Customers
Advanced filters include:
- $ Assignment Fee
- Accepted Turn Time (Working Days)
- Portfolio Assignment
- Improvement Size
Primary Filters
Each primary filter has a default setting and hierarchy of additional selections that can be made. Individual filter details are provided below.
Locations
Select the geographic area on which to query.
.png)
A. Locations: Select all locations (default setting). This is equivalent to a national query.
B. State: Select one or more states.
- To enable state-level selection functionality, you must first uncheck the default Select all State and Locations filter selection. Until that box is unchecked, the state-level selection area will remain grayed out and you will not be allowed to click on it, see drop-down lists, etc.
C. Location Type: Select one or more of EITHER CBSAs (CBSA = “Core Based Statistical Area”, parallel to a metro area) OR counties WITHIN the selected state(s). You cannot include a combination of CBSAs and Counties in a single report.
- To enable the Location Type functionality, select at least one state from the State selection box.
- Select either CBSA or County from the Location Typedrop-down menu.
- Once a location type has been selected, a CBSA or County drop-down menu will appear to the right of Location Type.
.png)
- Select one or more CBSAs or Counties. Available selections are determined by the CBSAs/counties associated with the selected state(s).
- Once a location type has been selected, a CBSA or County drop-down menu will appear to the right of Location Type.
Property Type
Select the classification of the underlying property on which to query. Insights uses a list of Property Types and Sub Types sourced from RIMS, which based its classification on the Appraisal Institute’s taxonomy. We have not updated our classification for the 2019 changes to the AI taxonomy.

A. Select All Property Types: Checked by default. It will return all Property Types. Uncheck to select an individual Property Type.
B. Property Type: Select a Property Type.
C. Property Sub-Type: Select one or more Property Sub-Types.
Dates
Select the time period to query on, choosing BOTH if/how the time period should be broken out into groups and the start/end dates.

Date Type: Select whether output should be grouped in annual periods, quarterly periods, or a single period.
- If Year (annual periods) or Year & Quarter (quarterly periods) is selected, define the date range by selecting dates via the From and To boxes.
- Periods selected are inclusive.
- User may choose single period.
- Date Range: If Date (single date range) is selected in the Date Type menu, select either (a) a specified date range via shortcut buttons (30 / 90 / 180 calendar days) or (b) a customized date range via the From and To boxes (either keying in dates or choosing dates from the calendar drop-downs).

- Dates selected, either explicitly via custom selection or implicitly via shortcut selection, are inclusive.
- Note: 7 days is the minimum date range allowed.
- Default selection = “Year & Quarter” with last 5 historical quarters
- Available dates
- Date End Point = last update of the Business Intelligence database. Note: Our database is updated overnight each Tuesday, Wednesday, Thursday, Friday, and Saturday.
- For annual and quarterly periods, a period is only made available once complete (example: 2019 available as a Year selection after the database updates post 12/31/2019).
- Date Start Point = 01/01/2006 (2006 for Year and Q1 2006 for Year & Quarter).
- Date End Point = last update of the Business Intelligence database. Note: Our database is updated overnight each Tuesday, Wednesday, Thursday, Friday, and Saturday.
Team Members
Select one or multiple team members within your organization to query on. “Team Member” is defined as an email address attached to an account within RIMSCentral and/or PARCEL that has been associated with a user’s organization in the Insights user administration site.

A. Team Members: Select all team members in your organization (default setting).
B. Team Member Email Patterns: Select one or more email domains belonging to vendors within your organization. Example: all @appraisalcorp.com
C. Team Member Email Addresses: Select one or more email addresses belonging to vendors within your organization. Example: john_doe@companyname.com
- To enable Team Member Email Patterns and Team Member Email Address selection functionality, you must first uncheck the default Select All X Team Member Patterns and All X Addresses filter selection. Until that box is unchecked, the other Team Member filters will remain grayed out and a user will not be allowed to click on them, see drop-down lists, etc.

Customers
Click the Select a customer box to expose a drop-down menu listing your customers. Click on one or more customers to add them as filter criteria. The report will only include data from those customers. Note that LightBox market data will not change based on this filter selection.
.png)
Advanced Filters
$ Assignment Fee
Filter report results to include only awarded assignments with an associated award fee meeting a user’s selected criteria. The Assignment Fee filter is disabled by default. Check the box next to the filter title to enable it.
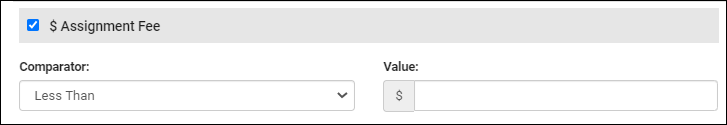
- Assignment Fee: Selects a filter comparator and value(s). Example: “Less Than” and $5,000.
- Comparator options: Less than, less than or equal to, greater than, greater than or equal to, in between.
- For “in between,” selected low / high values are inclusive.
- Comparator options: Less than, less than or equal to, greater than, greater than or equal to, in between.
Accepted Turn Time: Filter report results to include only awarded assignments with an associated accepted turn time between vendor and client meeting a user’s selected criteria. The Accepted Turn Time filter is disabled by default. Check the box next to the filter title to enable it.
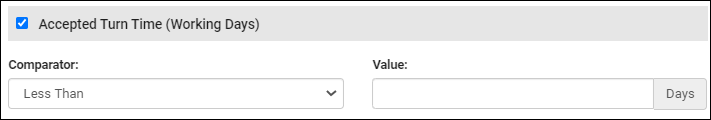
- Accepted Turn Time: Selects a filter comparator and value(s). Example: “In Between” and 10-15.
- Comparator options: Less than, less than or equal to, greater than, greater than or equal to, in between.
- For “in between,” selected low / high values are inclusive.
- Turn times are calculated using working days instead of calendar days (excluding weekends and holidays, and not counting the date of award - ex: an assignment awarded on Tuesday and due Thursday would have an Accepted Turn Time of 2 working days).
- Comparator options: Less than, less than or equal to, greater than, greater than or equal to, in between.
Portfolio Assignment: Filter report results based on an underlying property associated with an awarded assignment being part of a so-called “portfolio assignment.” The Portfolio Assignment filter is disabled by default. Check the box next to the filter title to enable it.
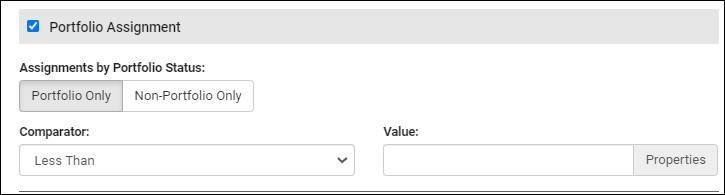
- Assignments by Portfolio Status: Select whether to include portfolio assignments only, or non-portfolio assignment only.
- Comparator: If Portfolio Only is selected, to filter on the size of the portfolio assignment (defined by property count) you may optionally select a filter comparator and value(s). Example: “Greater Than or Equal To” and 20.
Improvement Size: Filter report results to include only awarded assignments with an associated improvement size for the underlying property meeting a user’s selected criteria. The Improvement Size filter is disabled by default. Check the box next to the filter title to enable it.
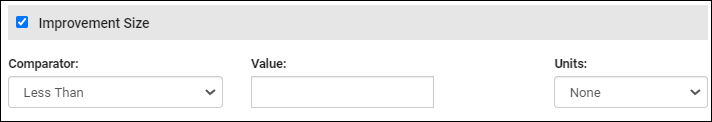
- Improvement Size: user selects a filter comparator, value(s), and measurement unit (ex: “Greater Than”, 100, and “Units”)
- Comparator options: Less than, less than or equal to, greater than, greater than or equal to, in between.
- For “in between”, selected low / high values are inclusive.
- Measurement unit selection defaults are based on property type selection. Selection of sub type(s) does not change the default. You may change the measurement unit by selecting any available value from the drop-down list.
- Comparator options: Less than, less than or equal to, greater than, greater than or equal to, in between.
Was this article helpful?