- Print
- DarkLight
- PDF
Properties - Map Tools
- Print
- DarkLight
- PDF
The Properties module contains a robust set of map tools: take measurements and add shapes, view layers for wetlands, school districts, population density, and numerous other data points, then export the maps for use in an appraisal report.
Measure
Measure via a polygon, line, or circle. Left-click to begin the measurement. Double-click to end the measurement.
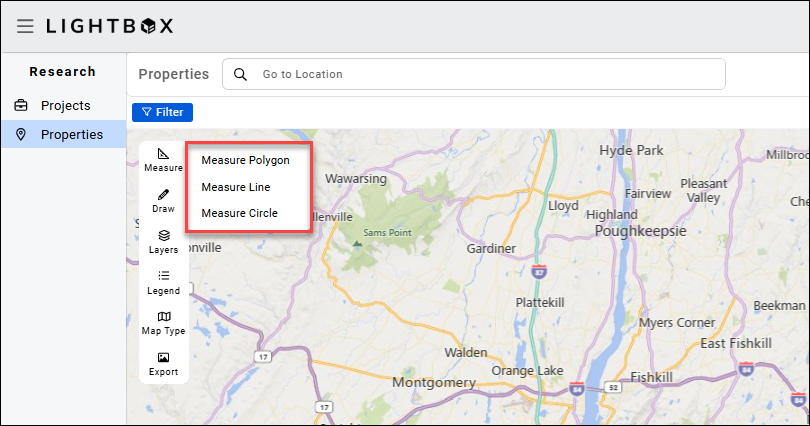
Click Measure Polygon in the Measure menu.
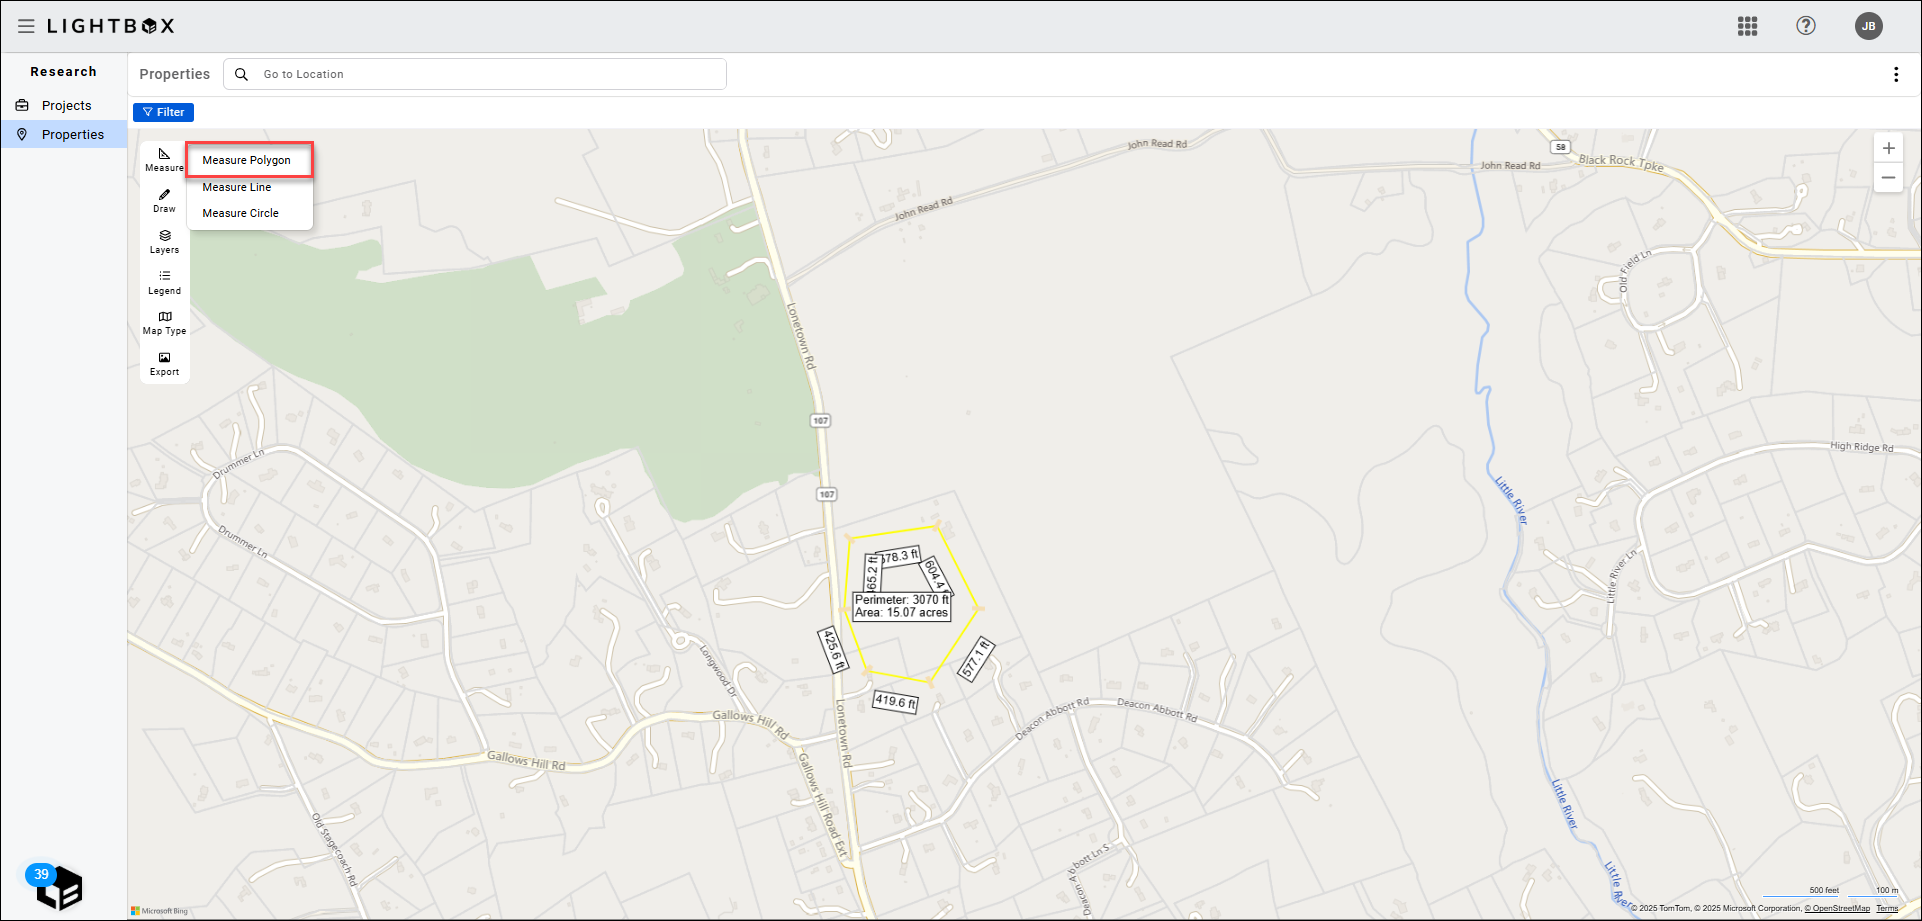
Click a location on the map to begin the measurement. Drag your mouse to the first point at which you need to change direction and then click again to add a vertex. Double-click to complete the polygon.
The length is displayed in a white text box.
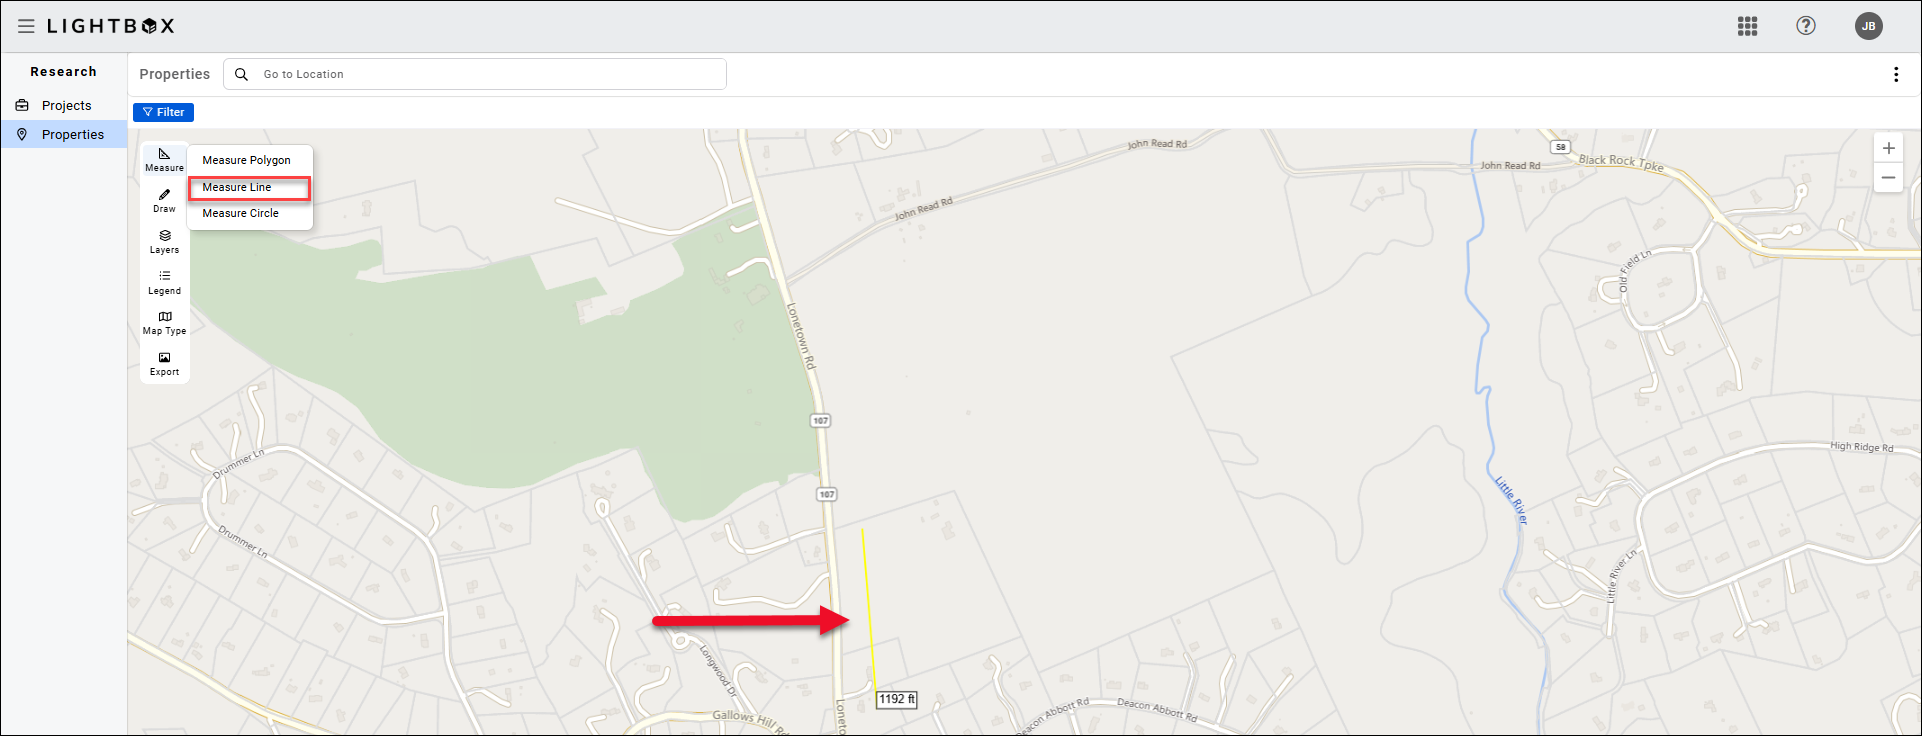
Click Measure Line in the Measure menu. Click the desired starting location on the map to begin the measurement, then drag your mouse to the desired ending location. Double-click to complete the line.
The length is displayed in a white text box.
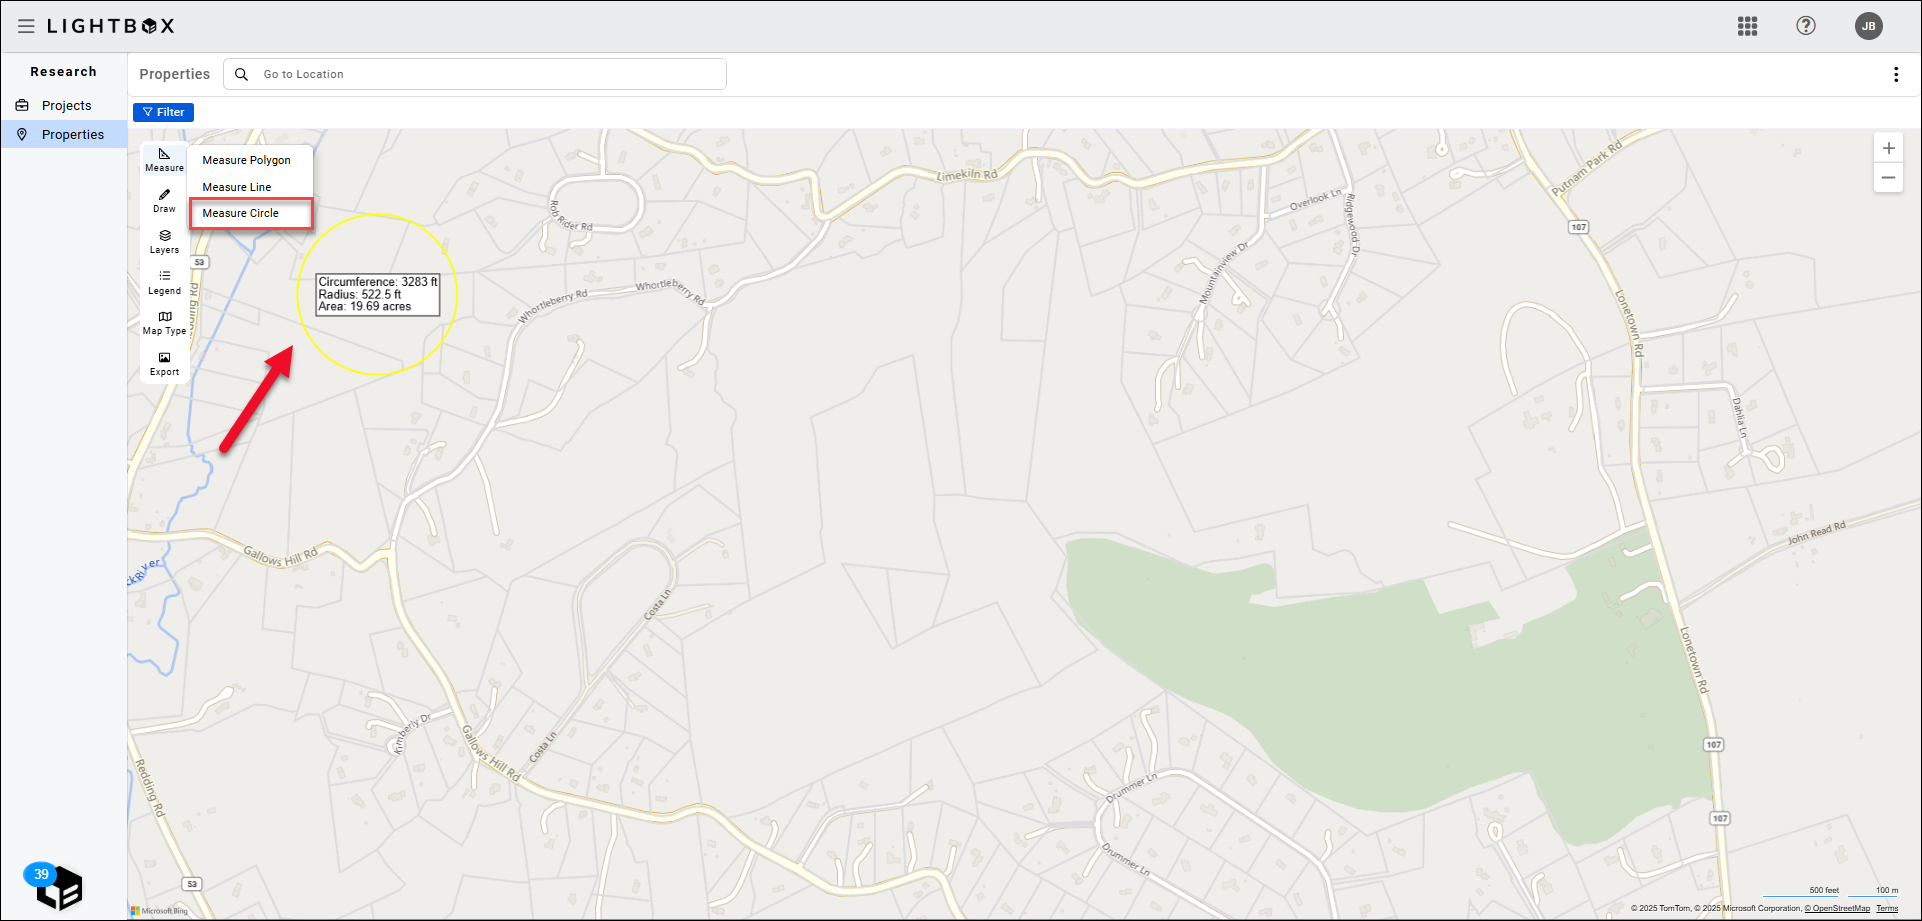
Click Measure Circle in the Measure menu.
Click a location on the map to begin the measurement. This spot will form the center of the circle. Drag the mouse to increase/decrease the size of the circle. Double-click to complete the circle.
The circumference, radius, and area are displayed in a white text box.
Draw
The Draw tools allow you to add shapes, labels, and icons to the map.

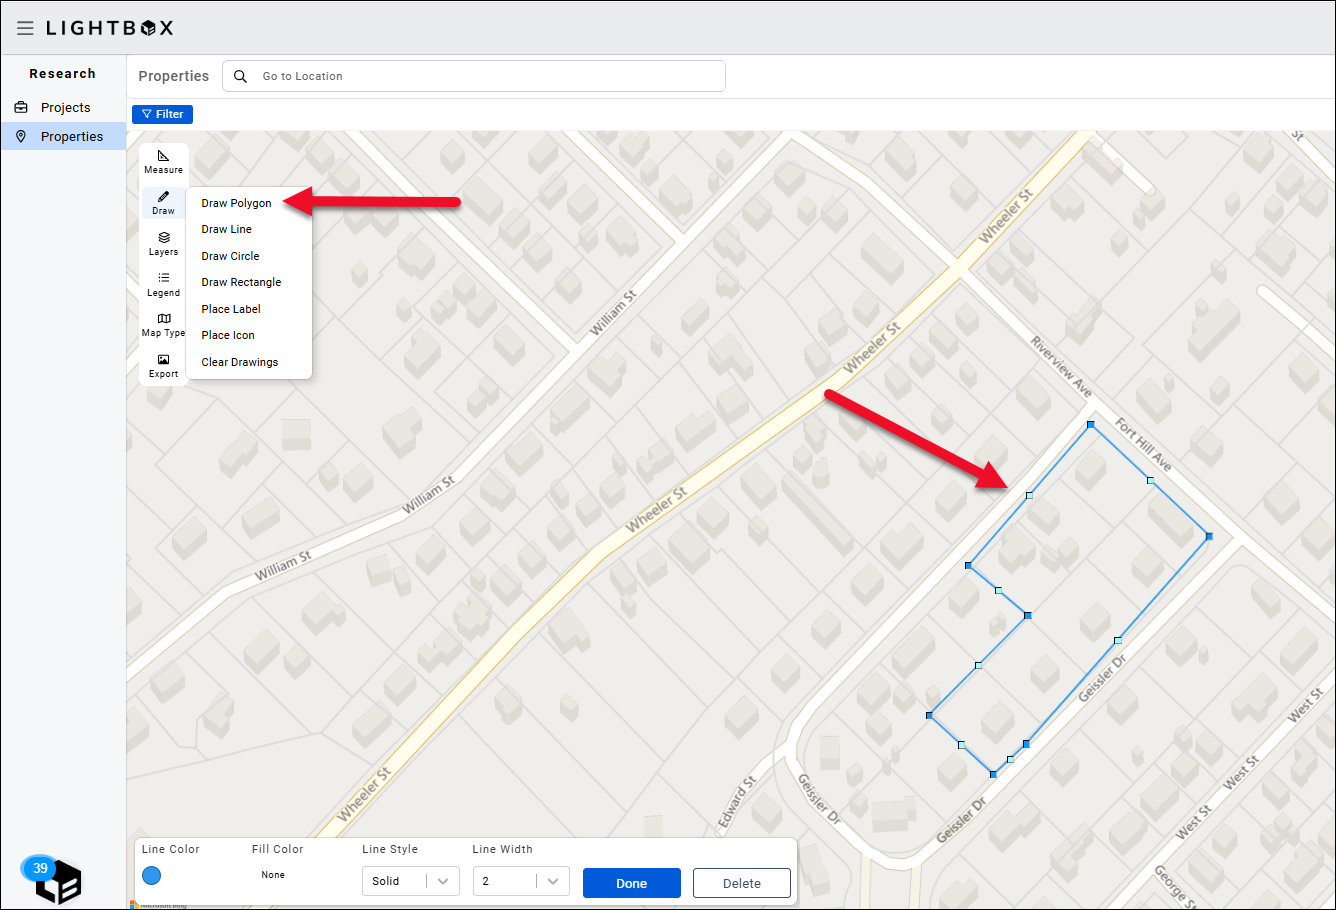
Click Draw Polygon in the Draw menu.
Click a location on the map to begin the measurement. Drag your mouse to the first point at which you need to change direction and then click again to add a vertex. When the ending location of the polygon meets the beginning, the polygon will be highlighted.
Click and drag one of the small, blue boxes to adjust the location of that point in the polygon.
The stroke color, fill color, stroke style, and stroke width can be customized in the menu at the bottom of the map.
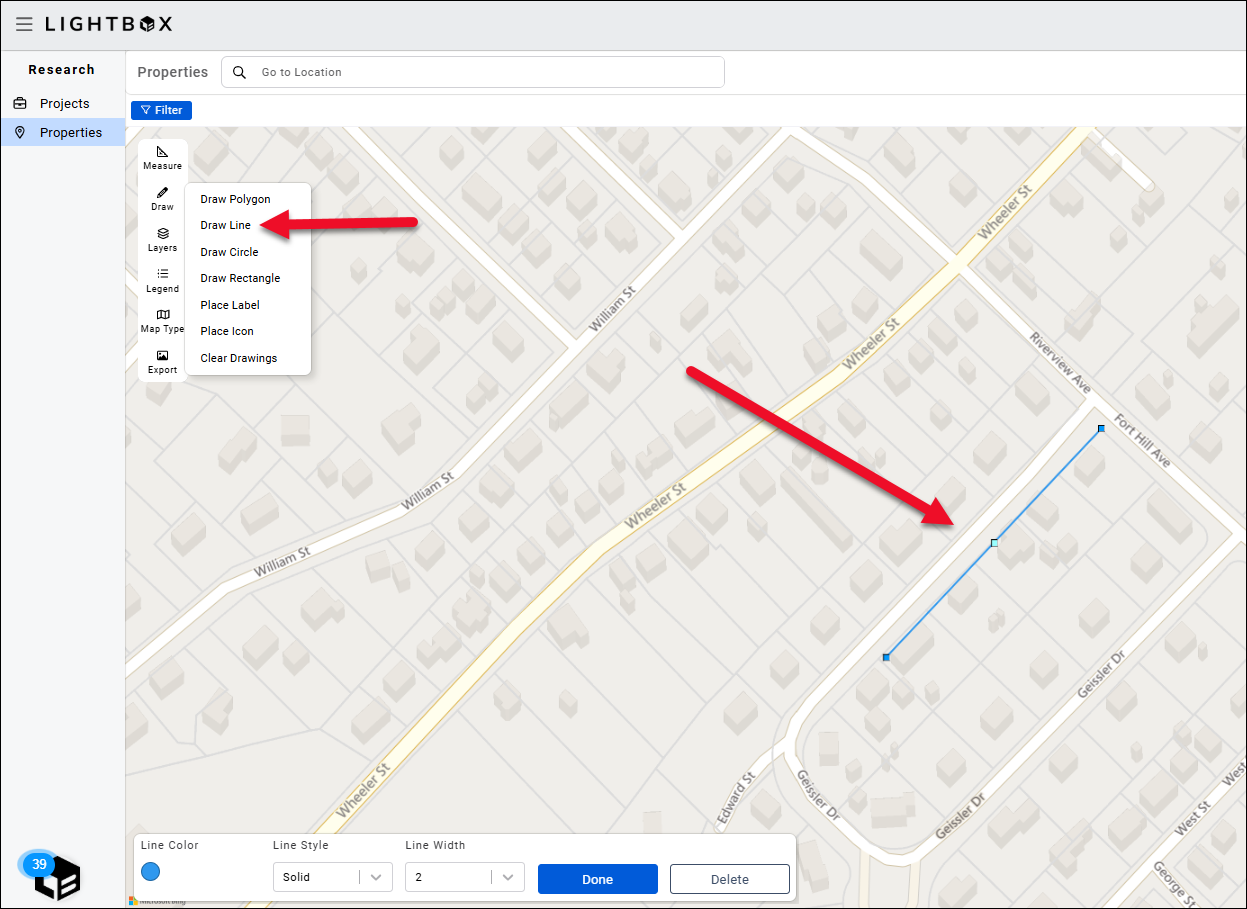
Click Draw Line in the Draw menu.
Click the desired starting location on the map to begin drawing the line, then drag your mouse to desired ending location. Double click to complete the line.
Click and drag one of the small, blue boxes to adjust the location of that point on the line.
The stroke color, stroke style, and stroke width can be customized in the menu at the bottom of the map.
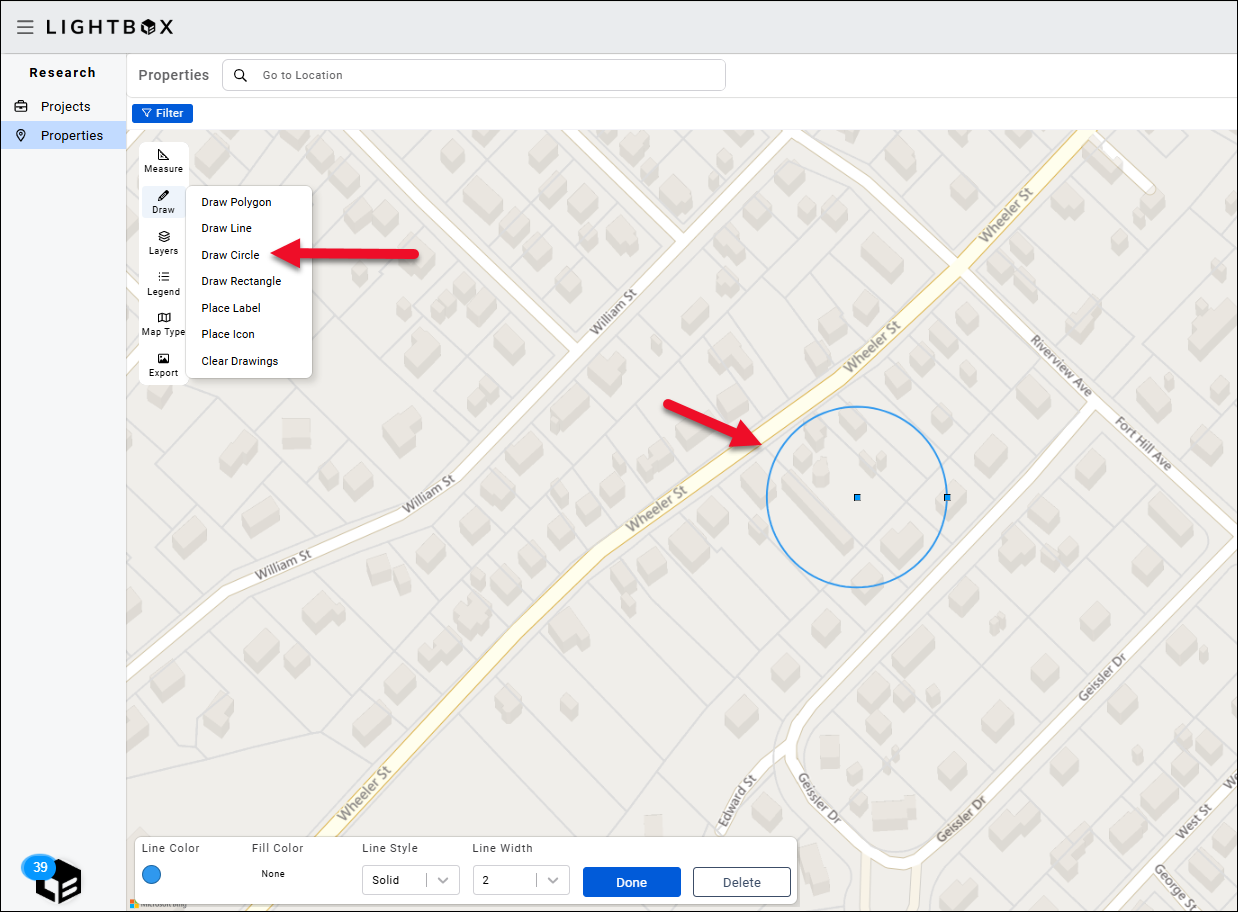
Click Draw Circle in the Draw menu.
Click a location on the map to place the center of the circle. Click and drag the small, blue box on the outside of the circle to increase/decrease the size of the circle.
Click and drag the blue box in the center of the circle to move the circle and/or resize the circle.
The stroke color, fill color, stroke style, and stroke width can be customized in the menu at the bottom of the map.
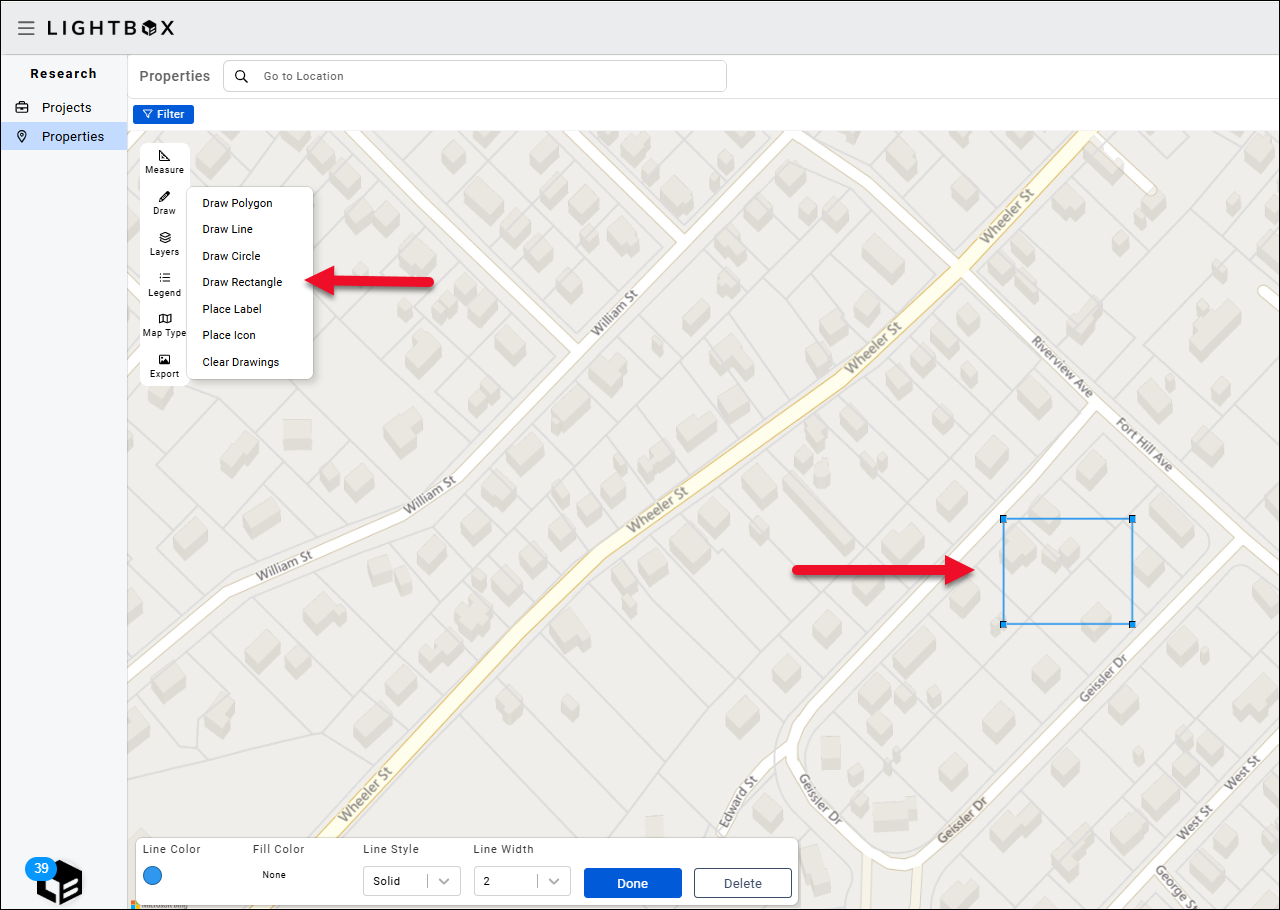
Click Draw Rectangle in the Draw menu.
Click a location on the map to place one corner of the rectangle. Drag the cursor to another location and click to finalize the placement of the rectangle.
Click one of the small, blue squares found in the corners of the rectangle to resize the rectangle.
The stroke color, fill color, stroke style, and stroke width can be customized in the menu at the bottom of the map.
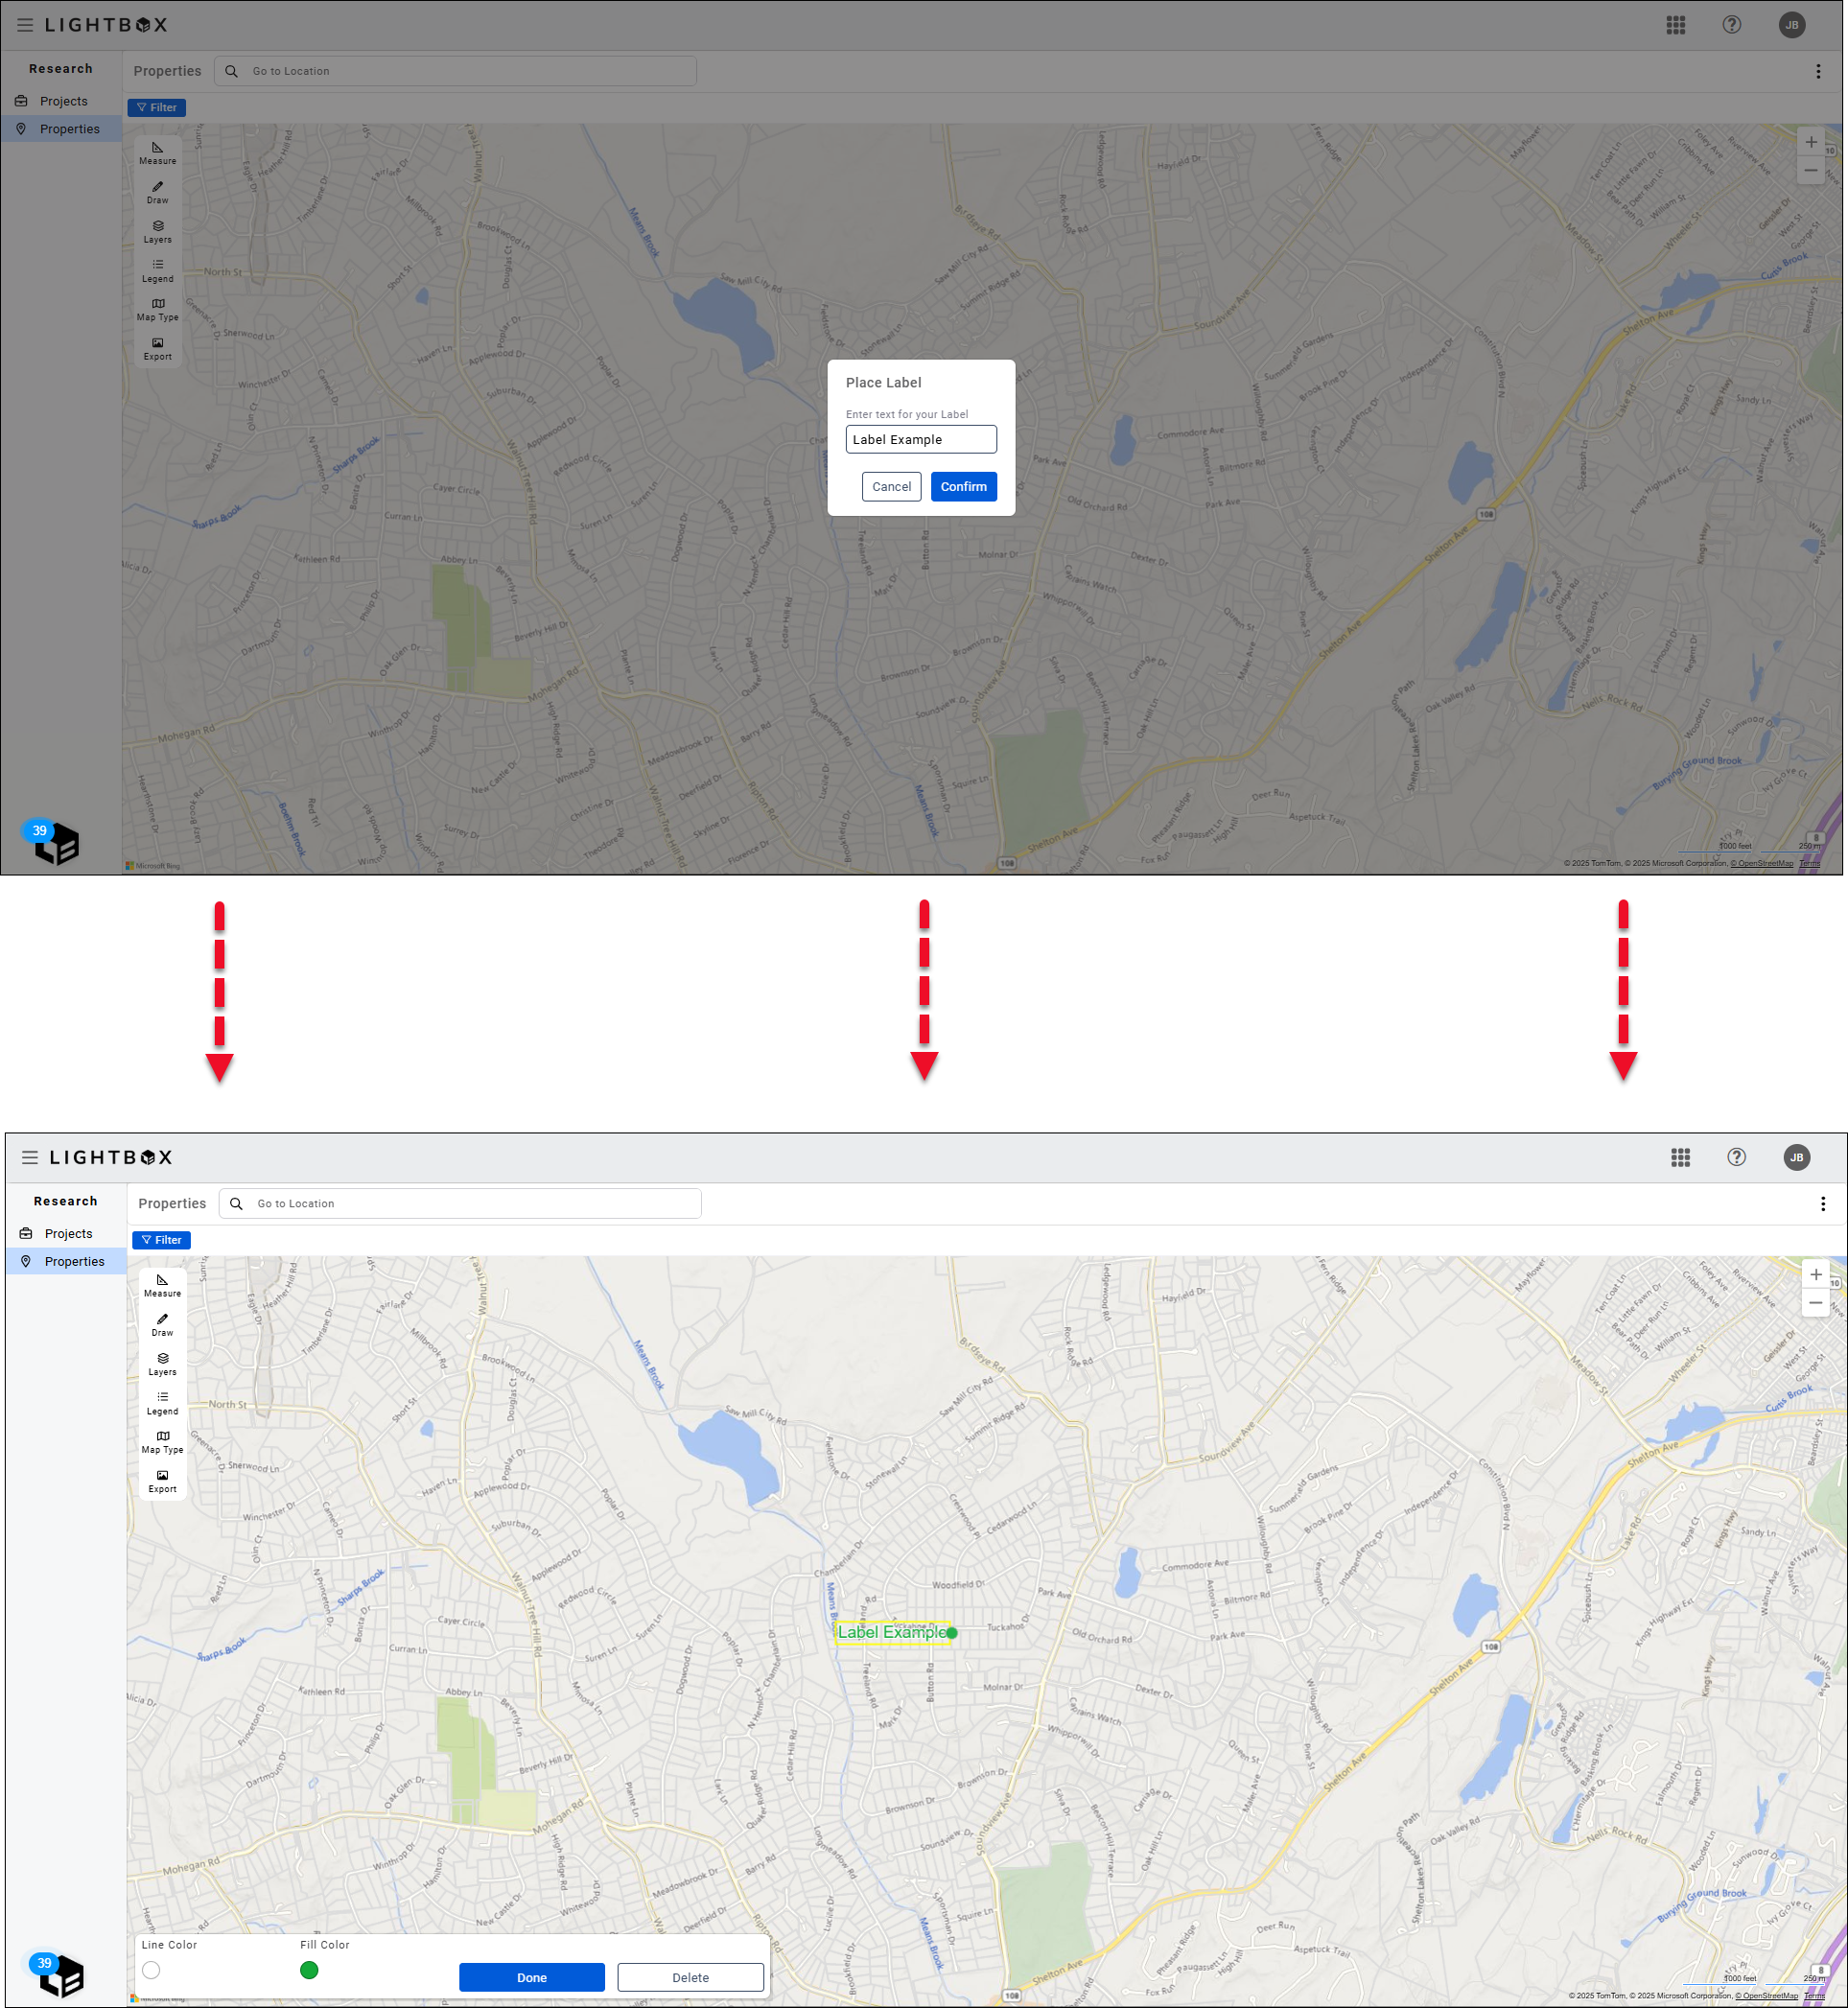
Click Place Label in the Draw menu. A pop-up will open; enter your desired label text and click Confirm.
Place the label in the desired location on the map. To move the label again, click inside the label box and drag the label to the desired location. To adjust the angle of the label, click the small, green circle to the right of the label and drag your mouse up or down.
The stroke color and fill color can be customized in the menu at the bottom of the map.
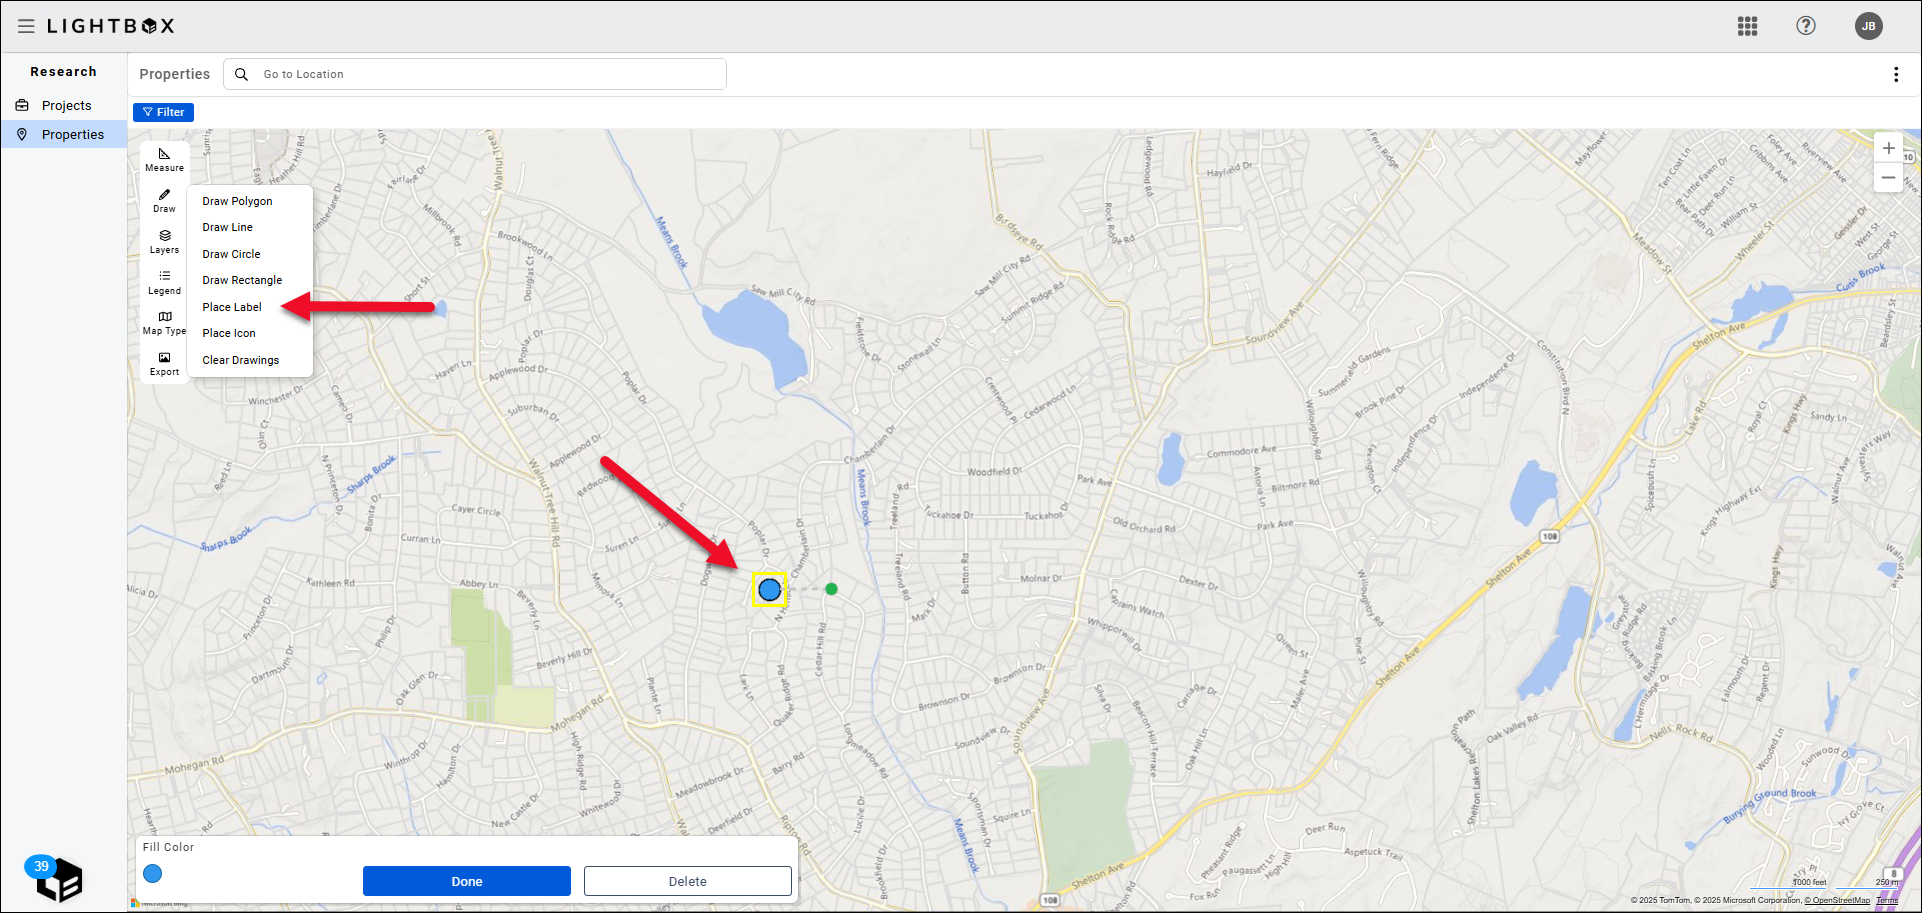
Click Place Icon in the Draw menu. Click a location on the map to place the icon. Once placed, you can click and drag the icon to move it to a different location.
Click the small circle to the right of the icon to rotate the icon.
The fill color can be customized in the menu at the bottom of the map.
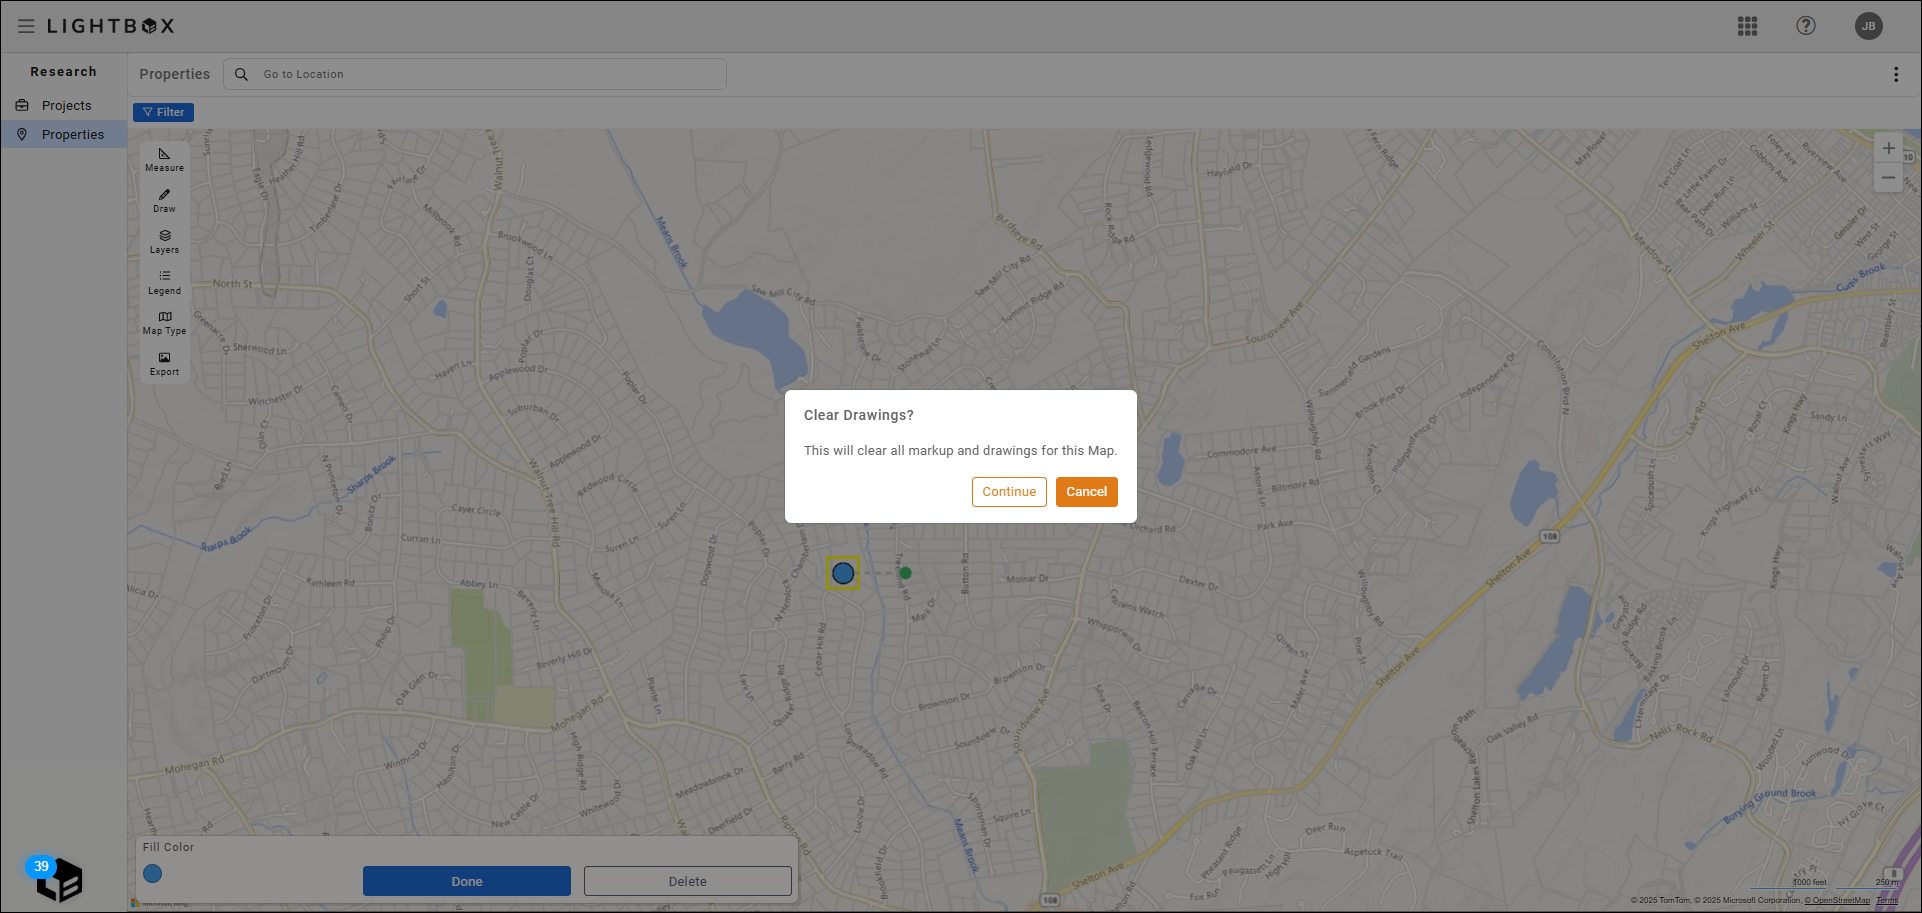
Click Clear Drawings in the Draw menu. A pop-up will request confirmation. Click Continue to delete all drawings.
Note: If you have a drawing selected when you have clicked Clear Drawings, that drawing will not be deleted.
Layers
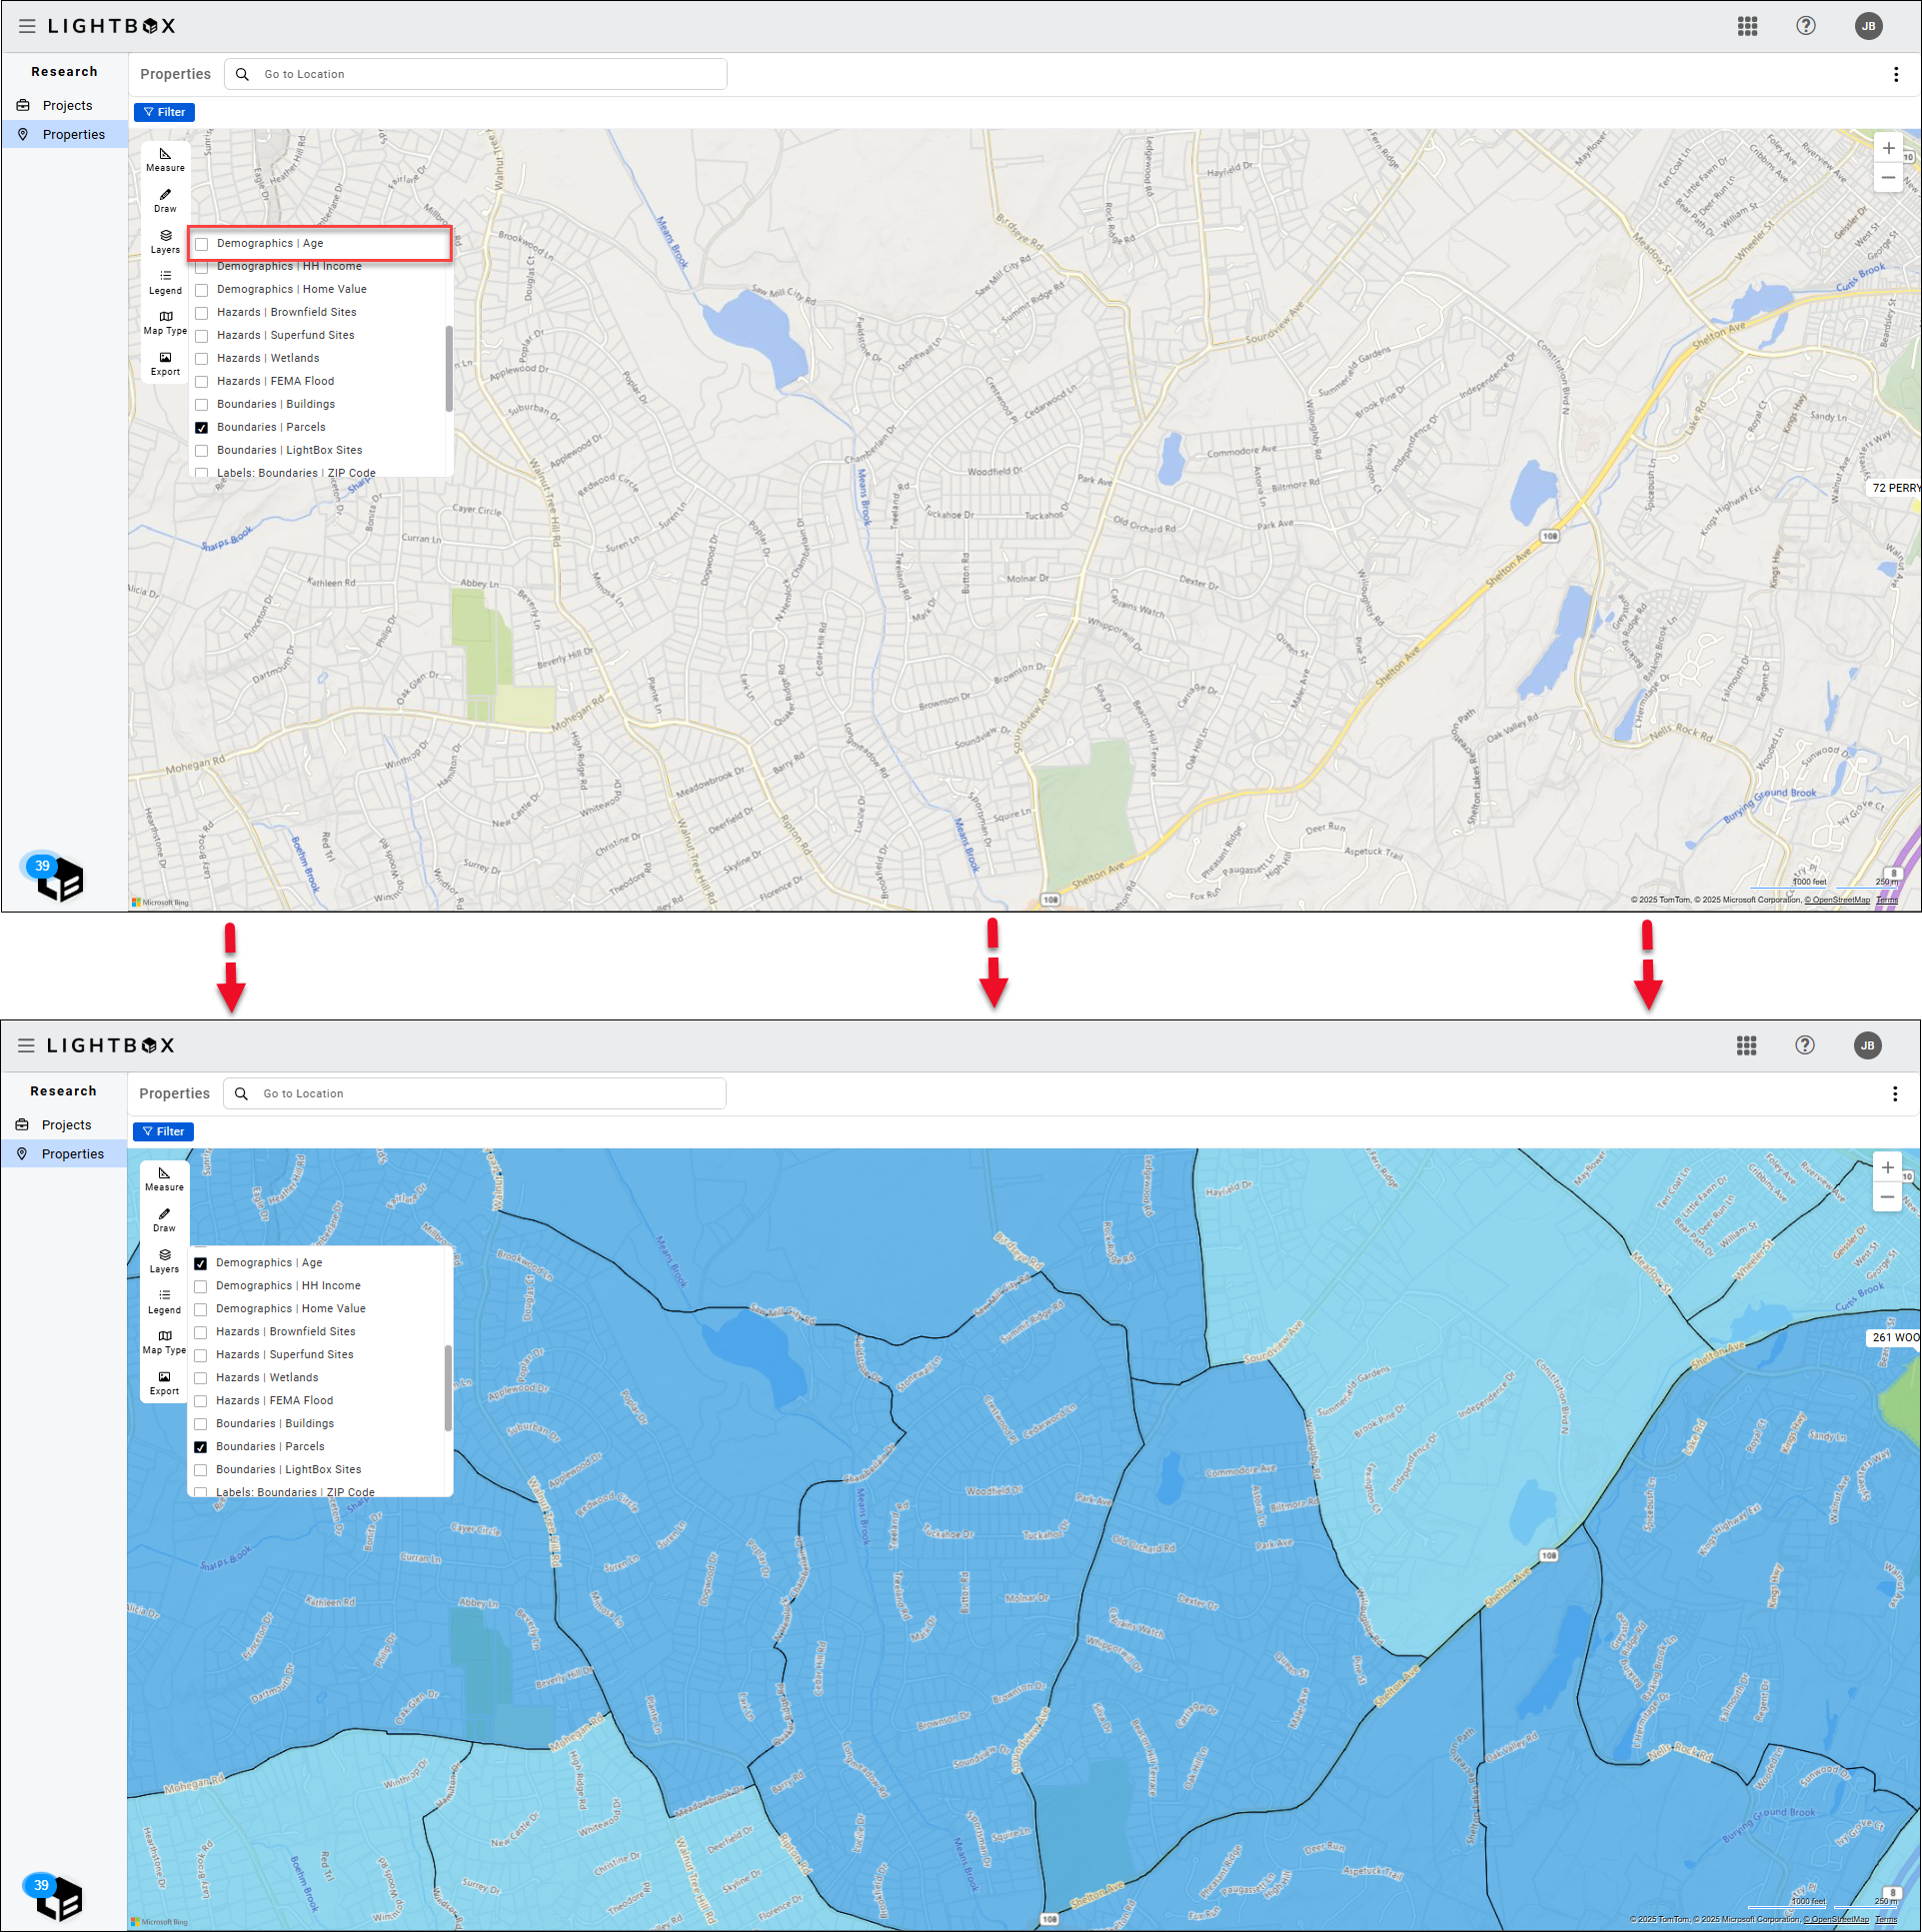
Users are provided with map layers to visualize data attributes. Click Layers and check/uncheck boxes to display/hide layers.
Legend
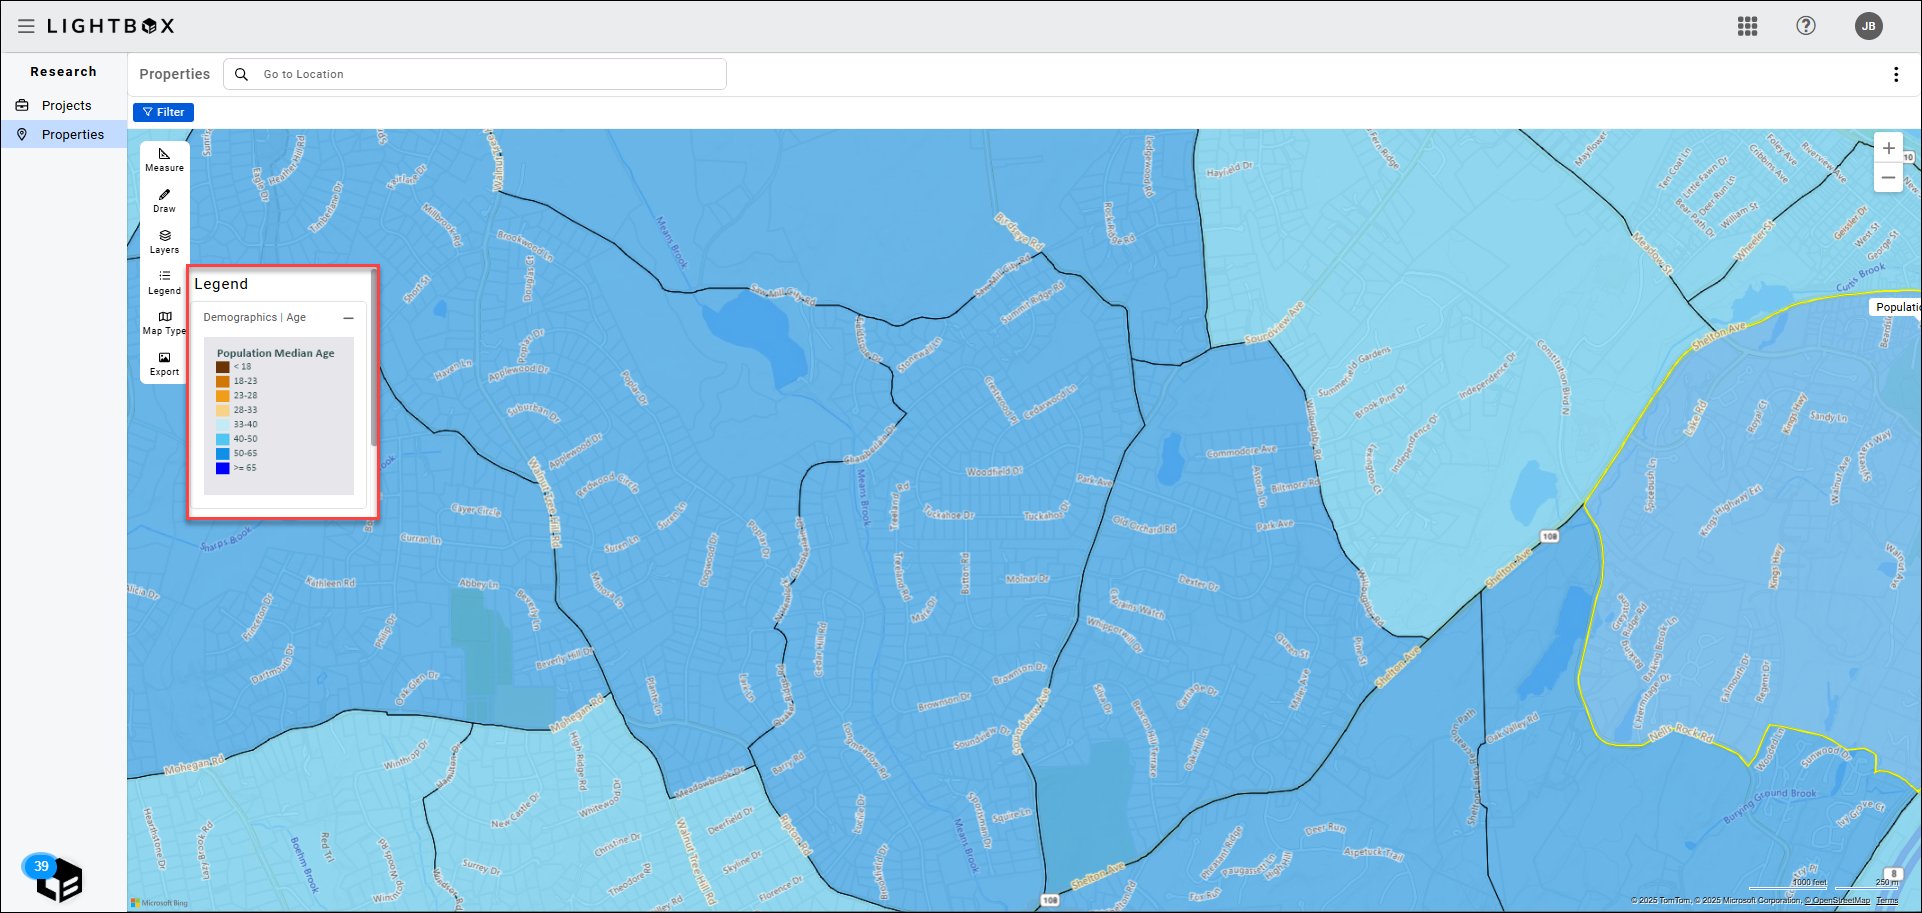
Map Type
Users can choose what type of map to display.
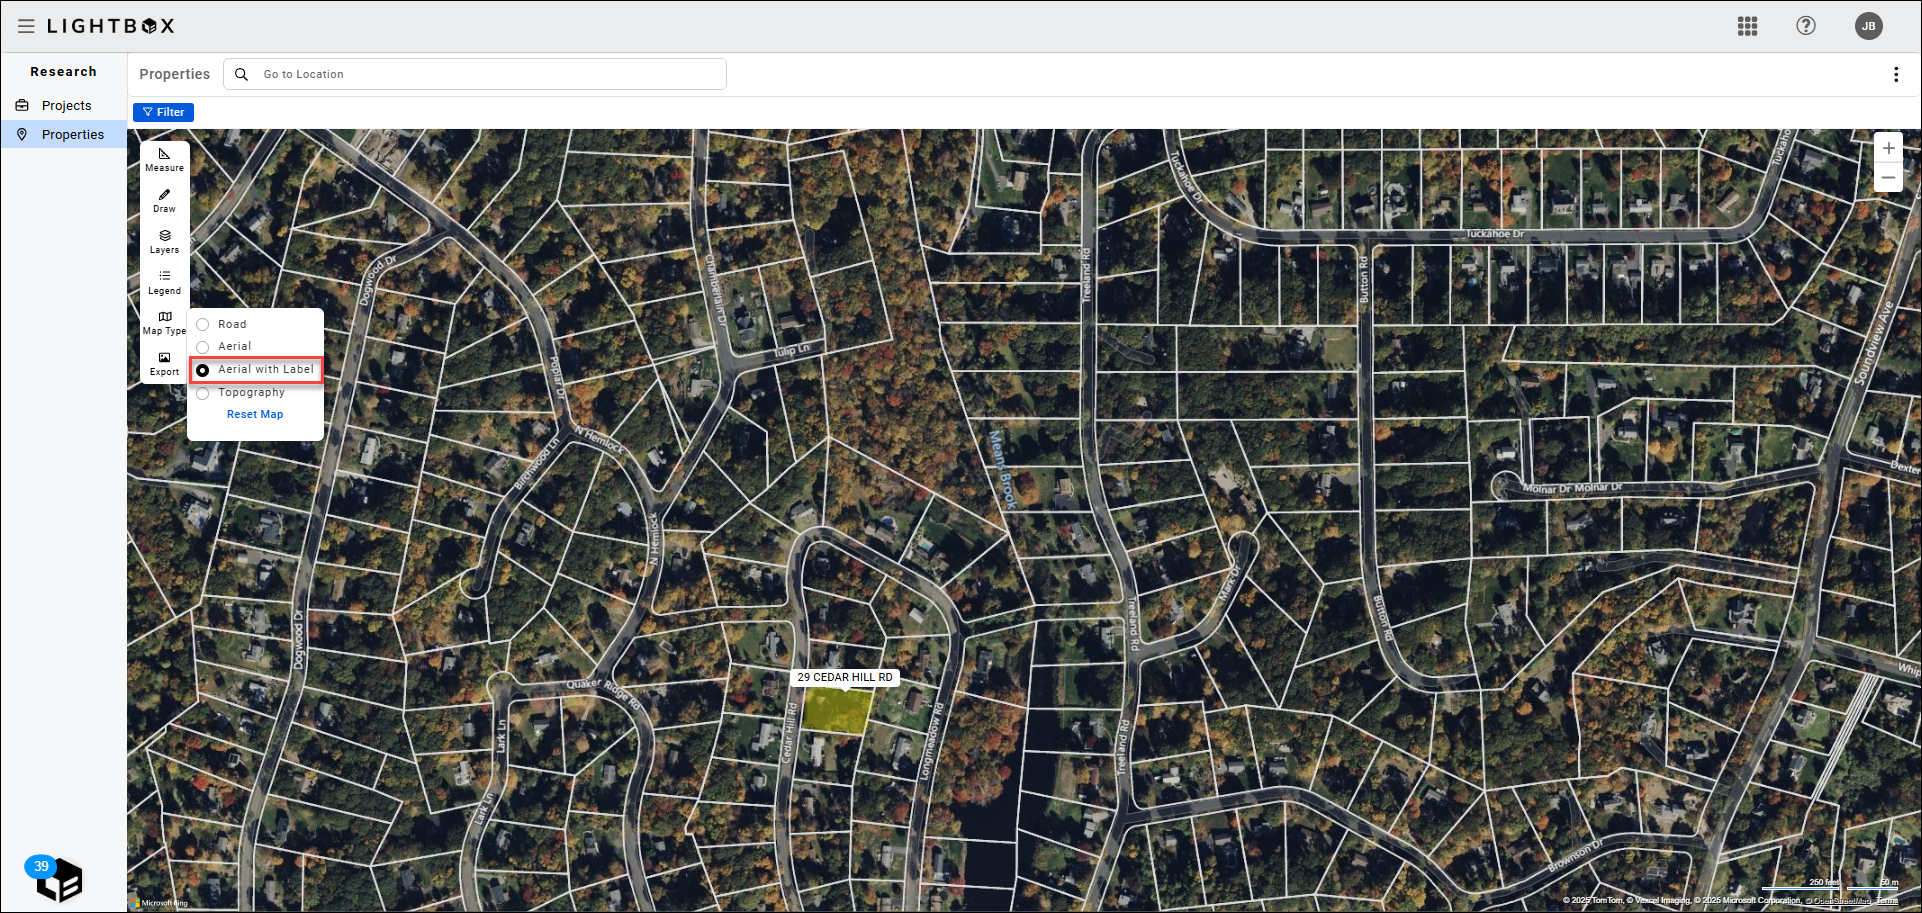
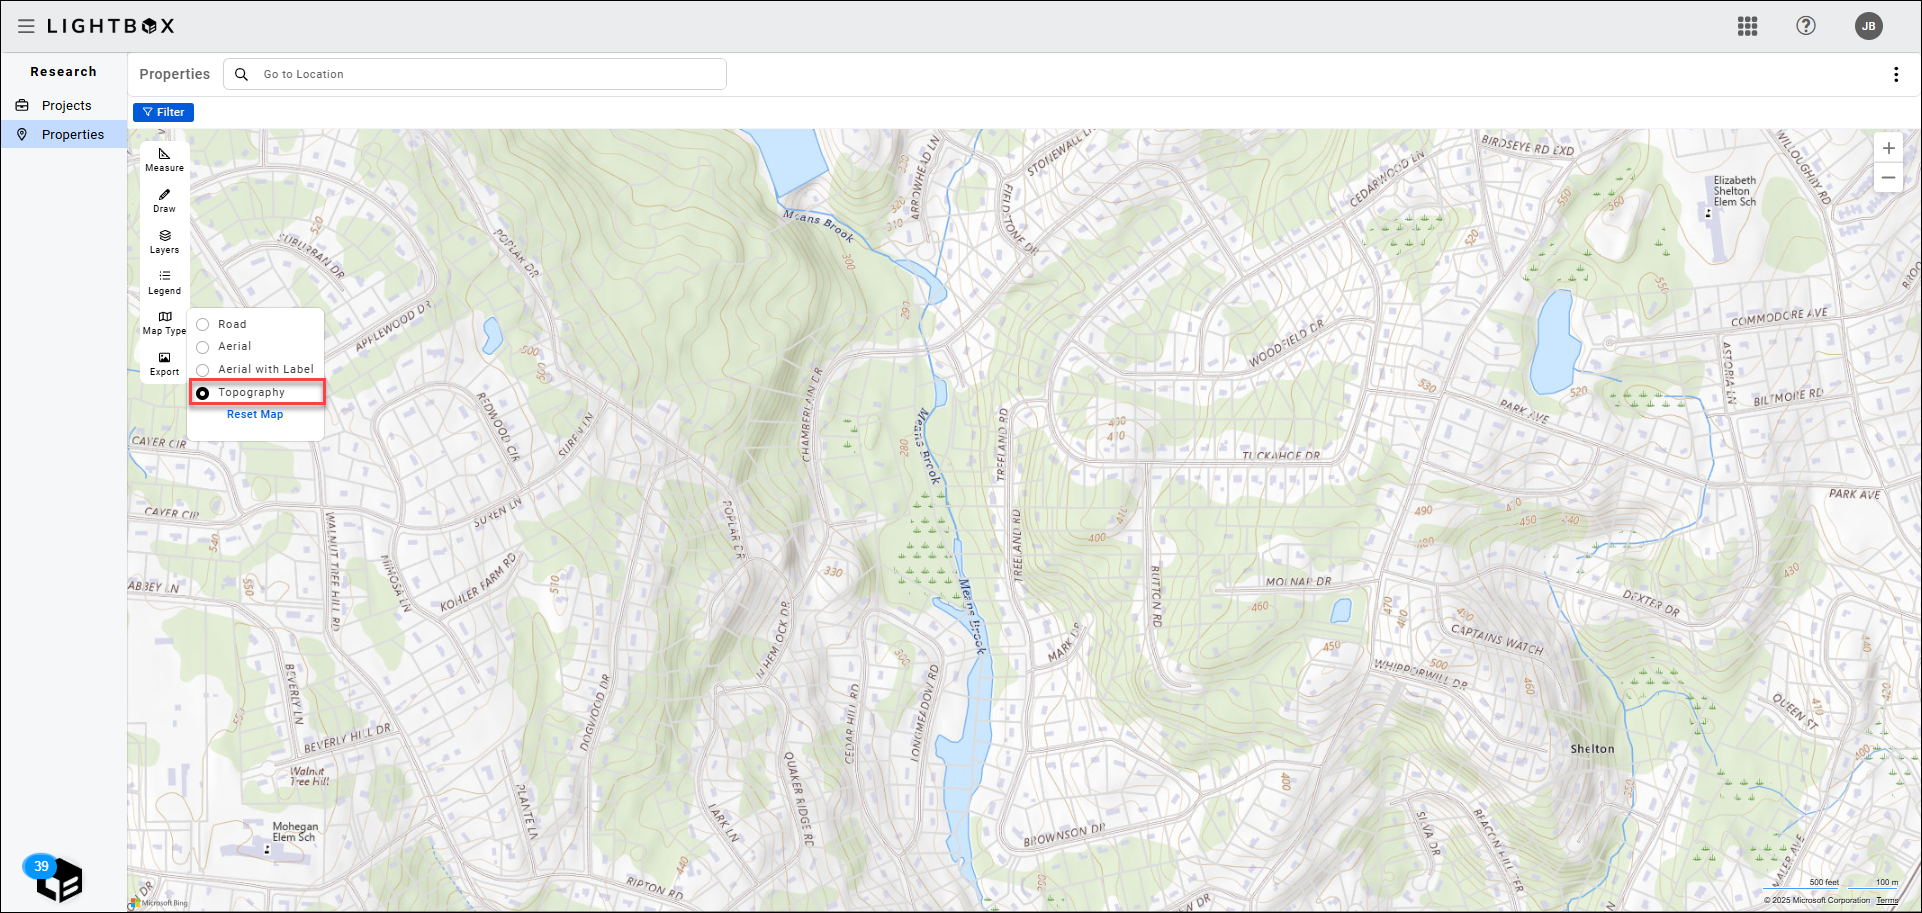
Options include Road, Aerial, Aerial with Label, and Topography.
Click Reset Map to return to the Aerial with Label map type and zoom out to the default view of the United States.
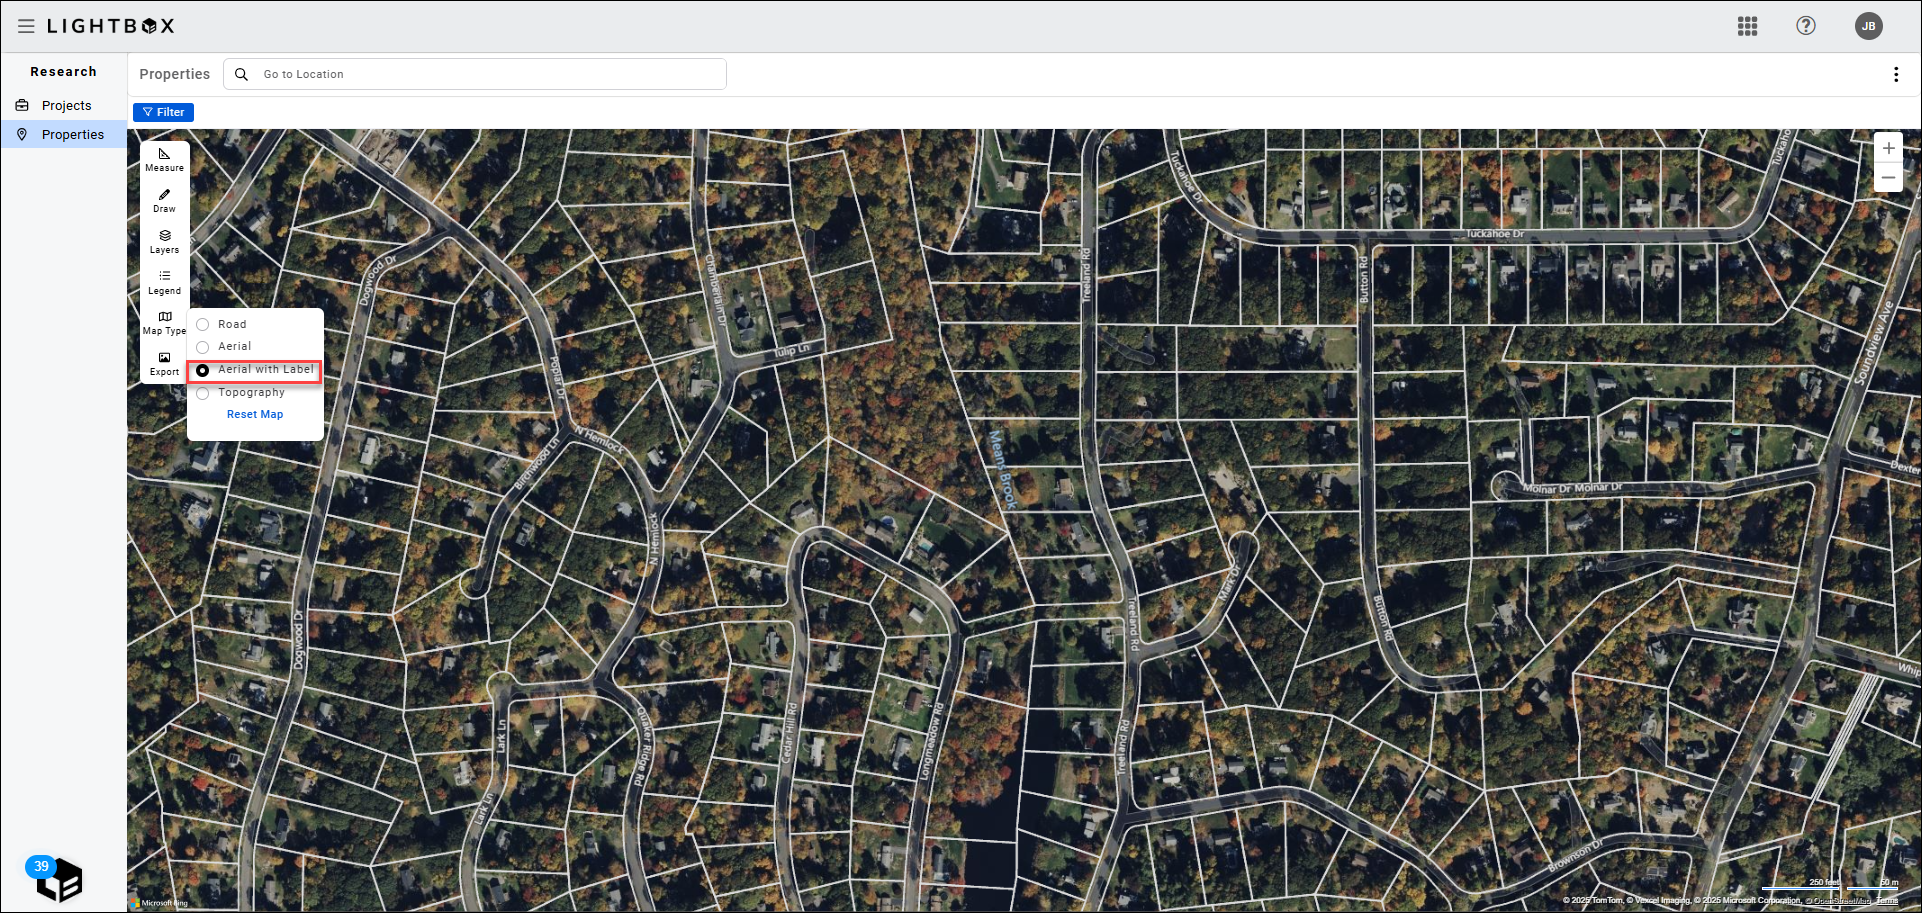
Road map example.
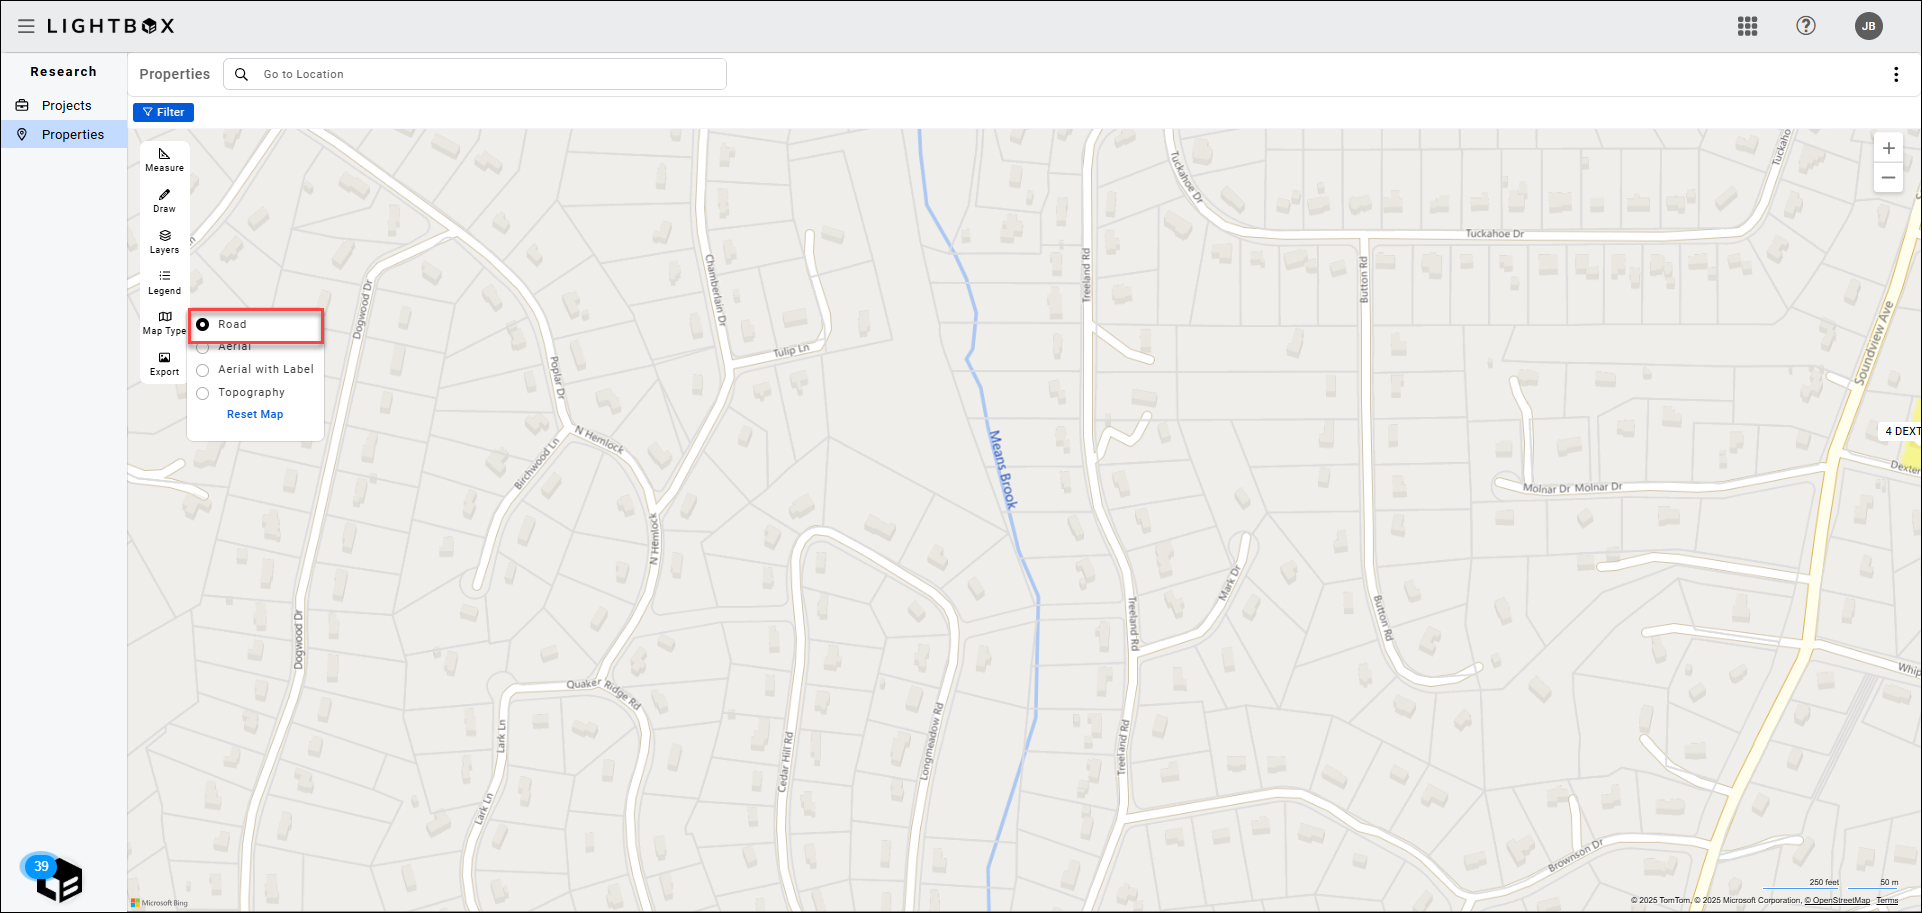
Aerial map example.
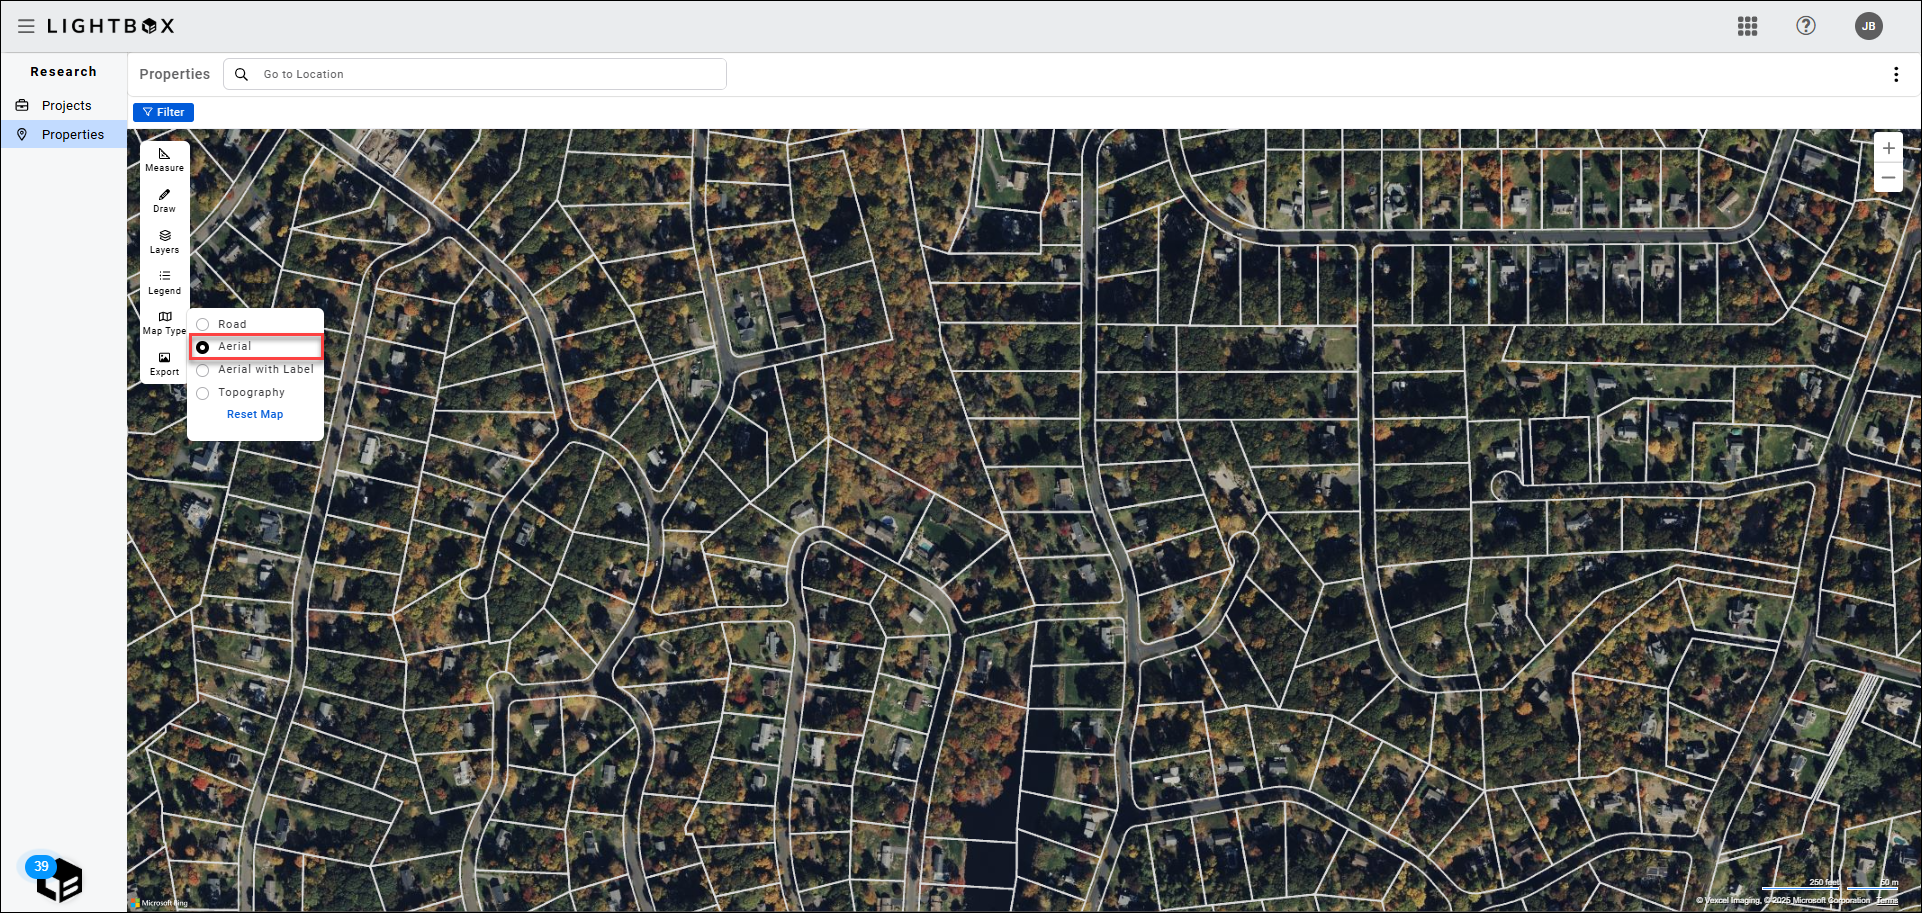
Aerial with Label map example.
Topography map example.
.png)

.png)