Site
- Print
- DarkLight
- PDF
Site
- Print
- DarkLight
- PDF
Article summary
Did you find this summary helpful?
Thank you for your feedback!
Exhibits in the Site object include maps with layers, measurement, and drawing tools to support quick exhibit creation and data derivation.
Exhibits Bar
Subject Map
The Subject Map exhibit can be used as a location map or as an access map. It includes measurement tools, described below.
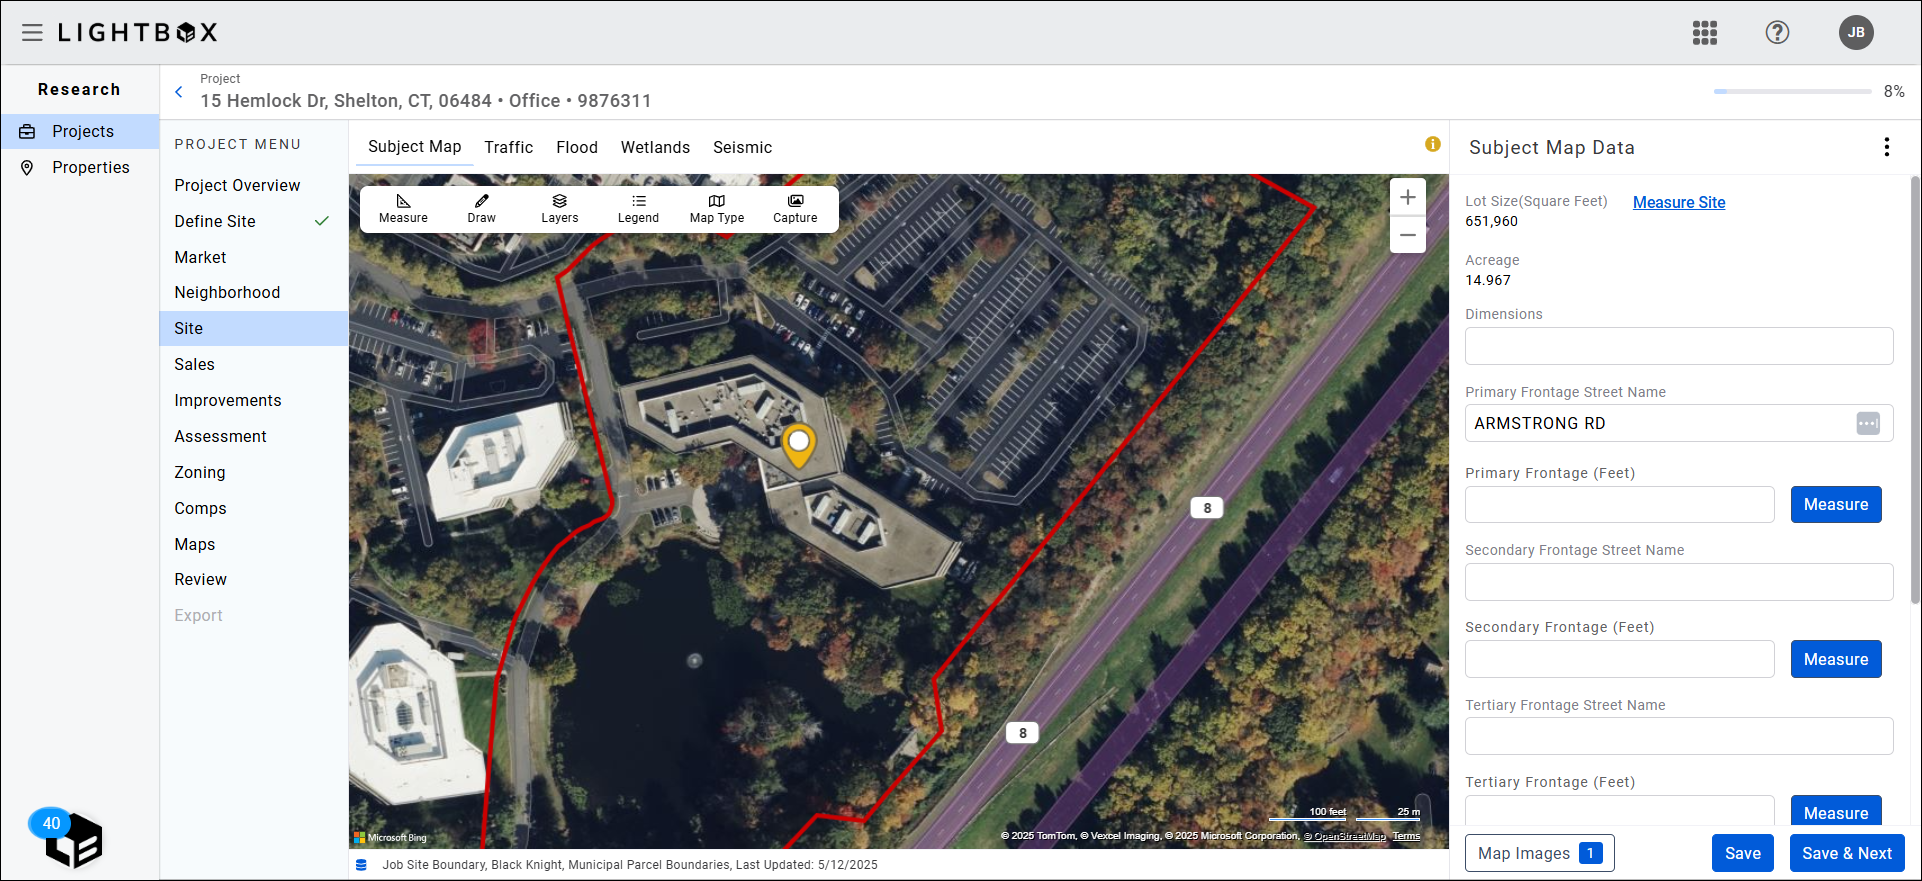
Subject Map - Measure Frontage
Click the Measure button next to Primary Frontage, Secondary Frontage, or Tertiary Frontage to measure the respective frontage.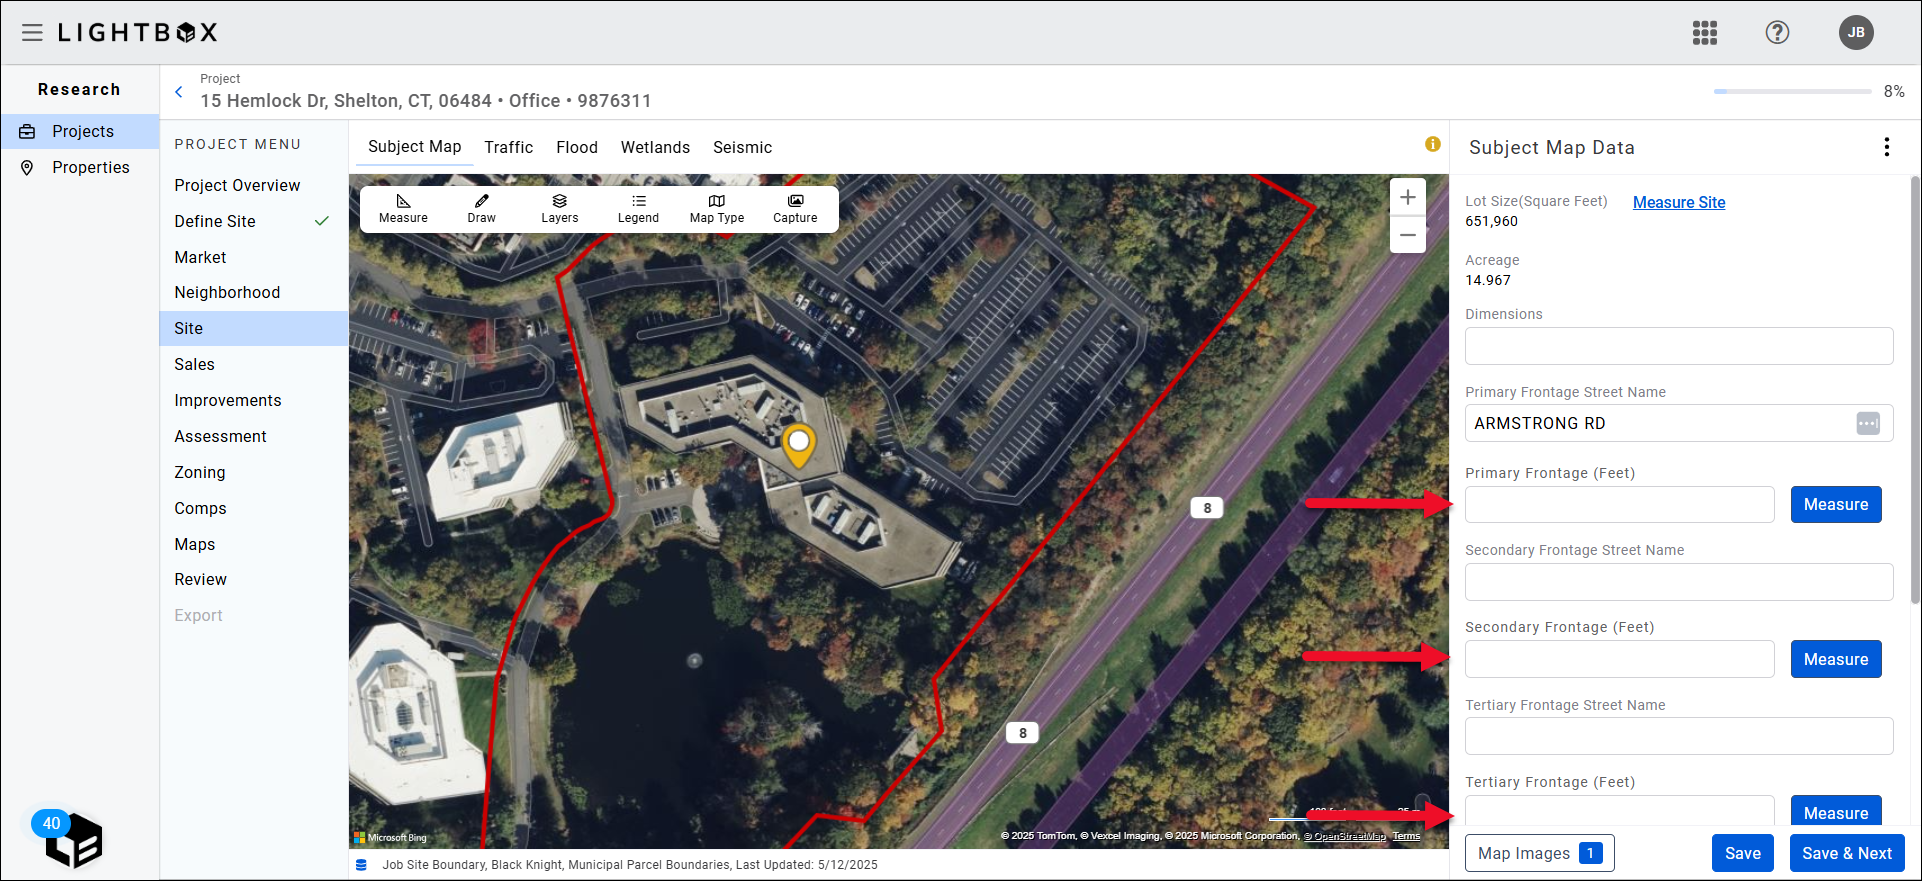 Initial view, with Primary, Secondary, and Tertiary frontage values
Values entered in the Primary Frontage Street Name, Secondary Frontage Street Name, and Tertiary Frontage Street Name fields populate the corresponding fields in the Traffic exhibit. The reverse is also true: values entered in those fields in the Traffic exhibit will populate the corresponding fields in the Subject Map exhibit.
Note: The Primary Frontage Street Name and Land Use fields may be automatically populated, based on the parcels selected in the Define Site section. If all Parcels selected have the same Street Name and Land Use, they will pre-populate.
Subject Map - Measure Site
Click the Measure Site button to show/hide the site boundary measurements on the map.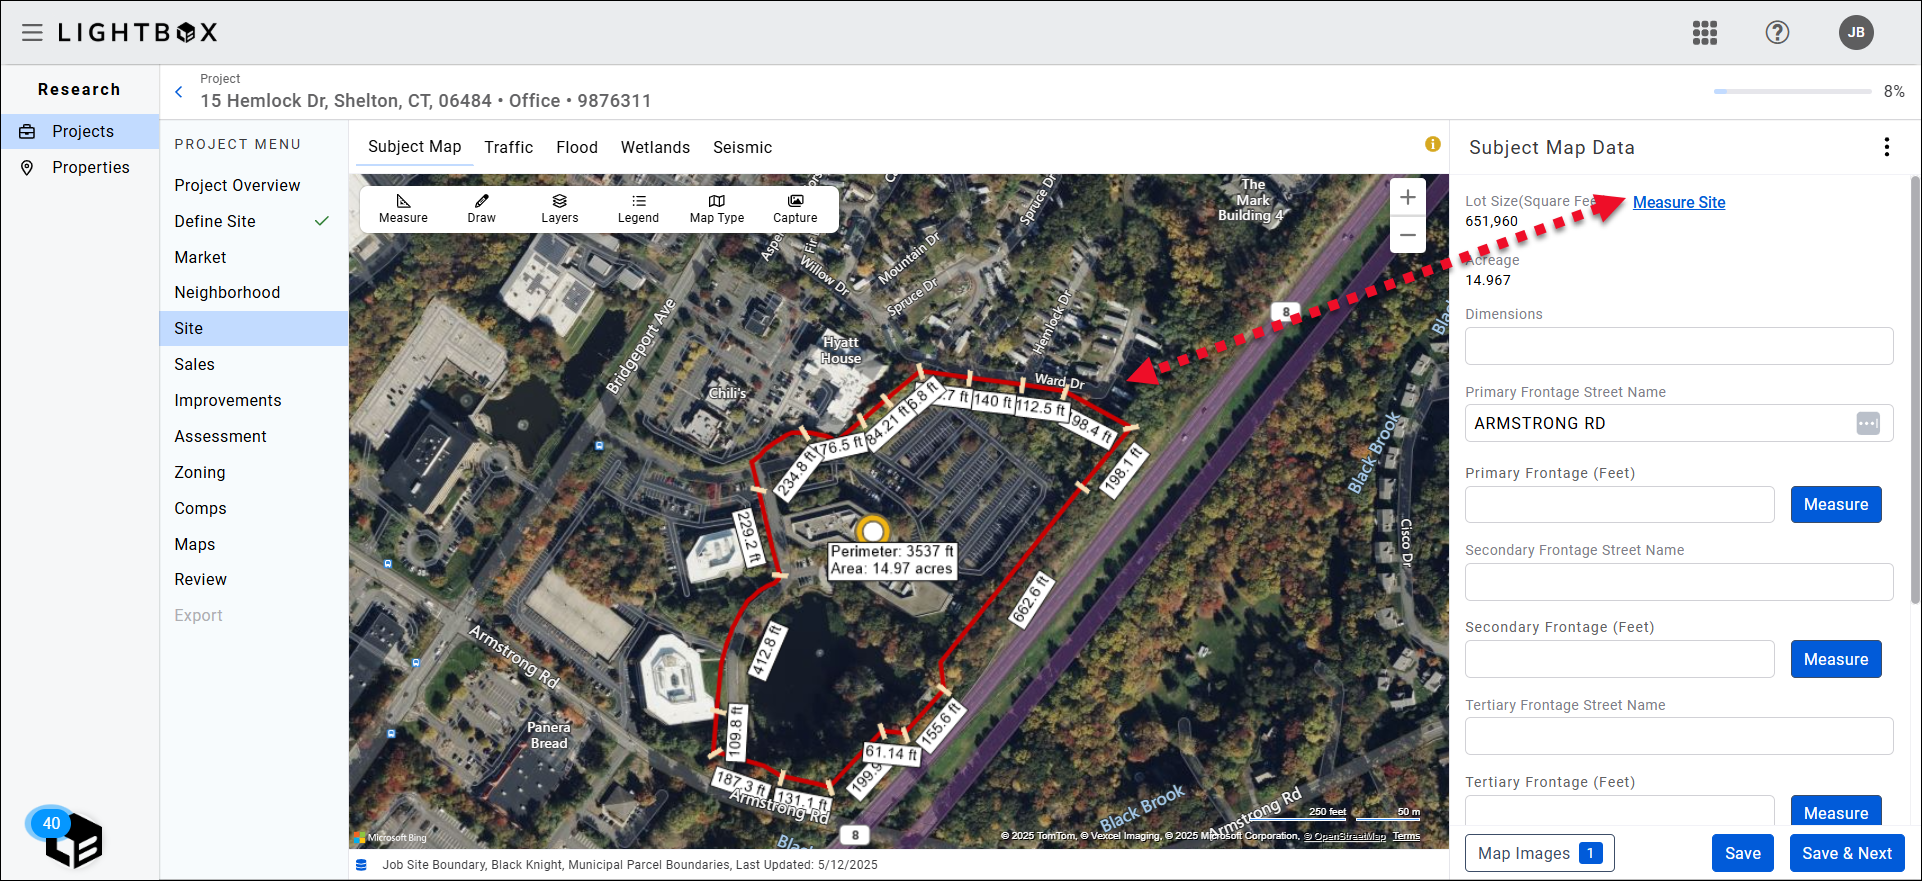
Click the Measure button to the right of Usable Land Area (SF). A message appears at the top of the screen and states:
Click anywhere on the map to start the measurement.
Single-click to add a point to the shape.
Double-click to enclose the shape and log area measurement..png)
Usable Land Area (SF) and Excess Land Area (SF) fields
Follow the instructions to draw a polygon enclosing the usable land area. Once the polygon is complete, the square-footage value appears in the Usable Land Area (SF) field. The field value can be edited manually by clicking in the field and entering a new a value.
The Excess Land Area (SF) Measure tool functions the same way as the Usable Land Area (SF) Measure tool.Usable Land Area (SF) field value entered and polygon draw on the map.
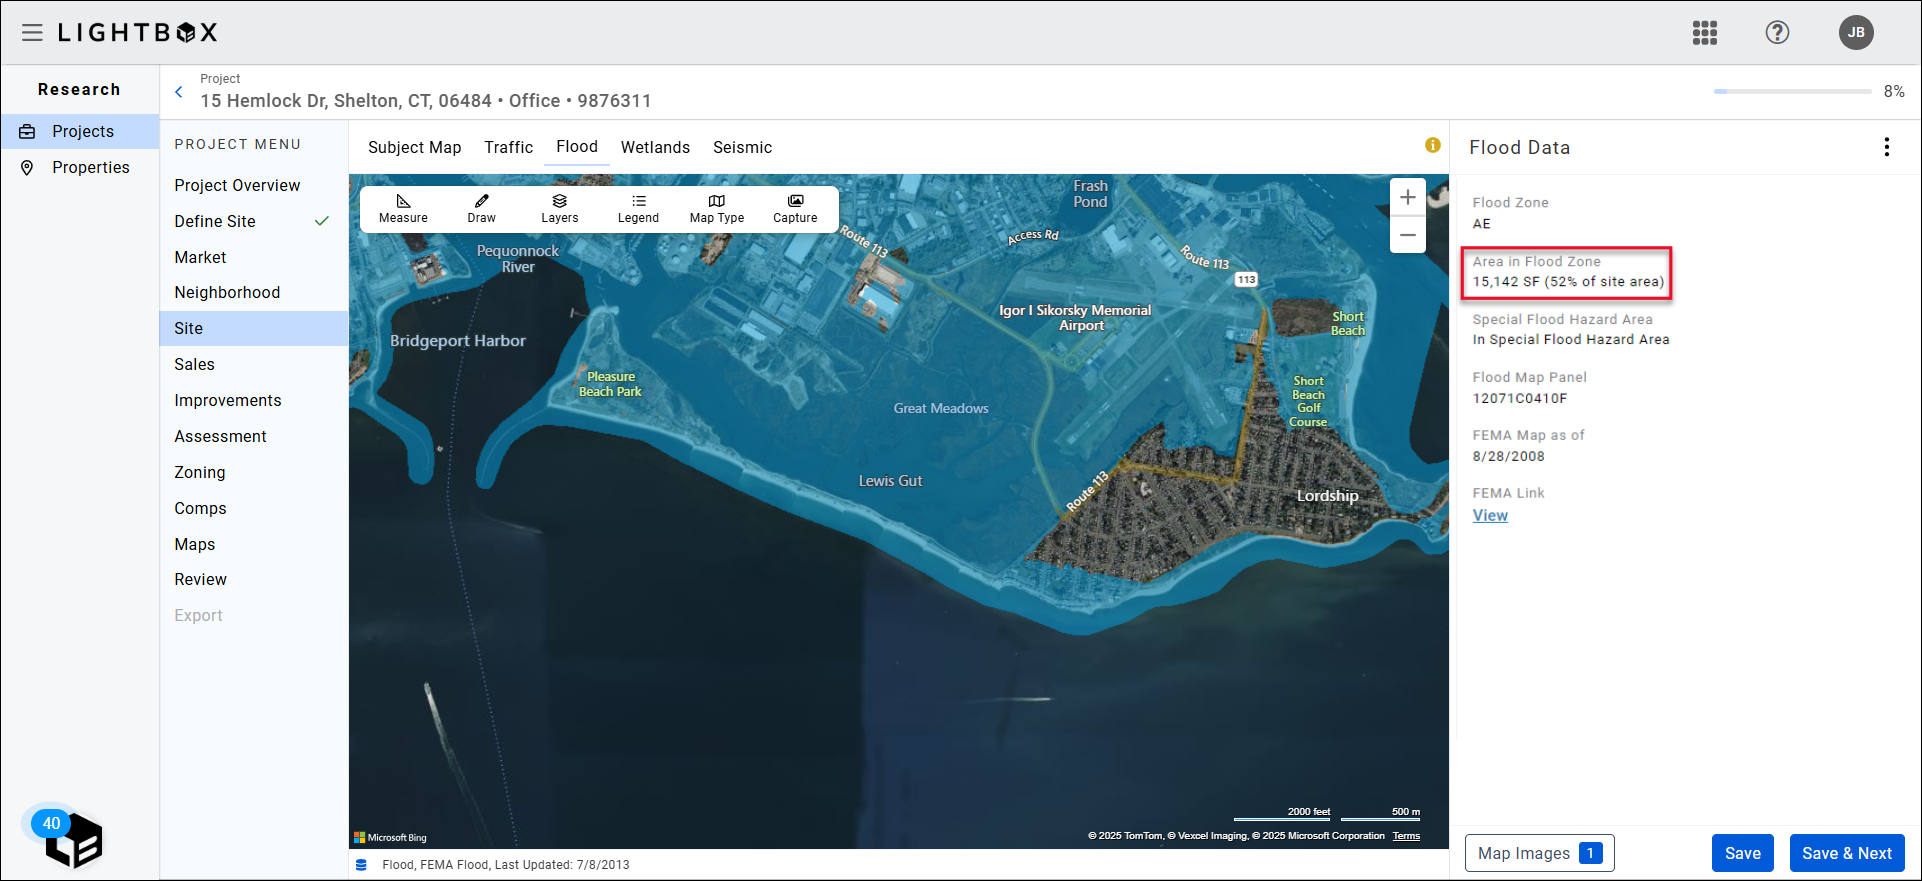
Flood
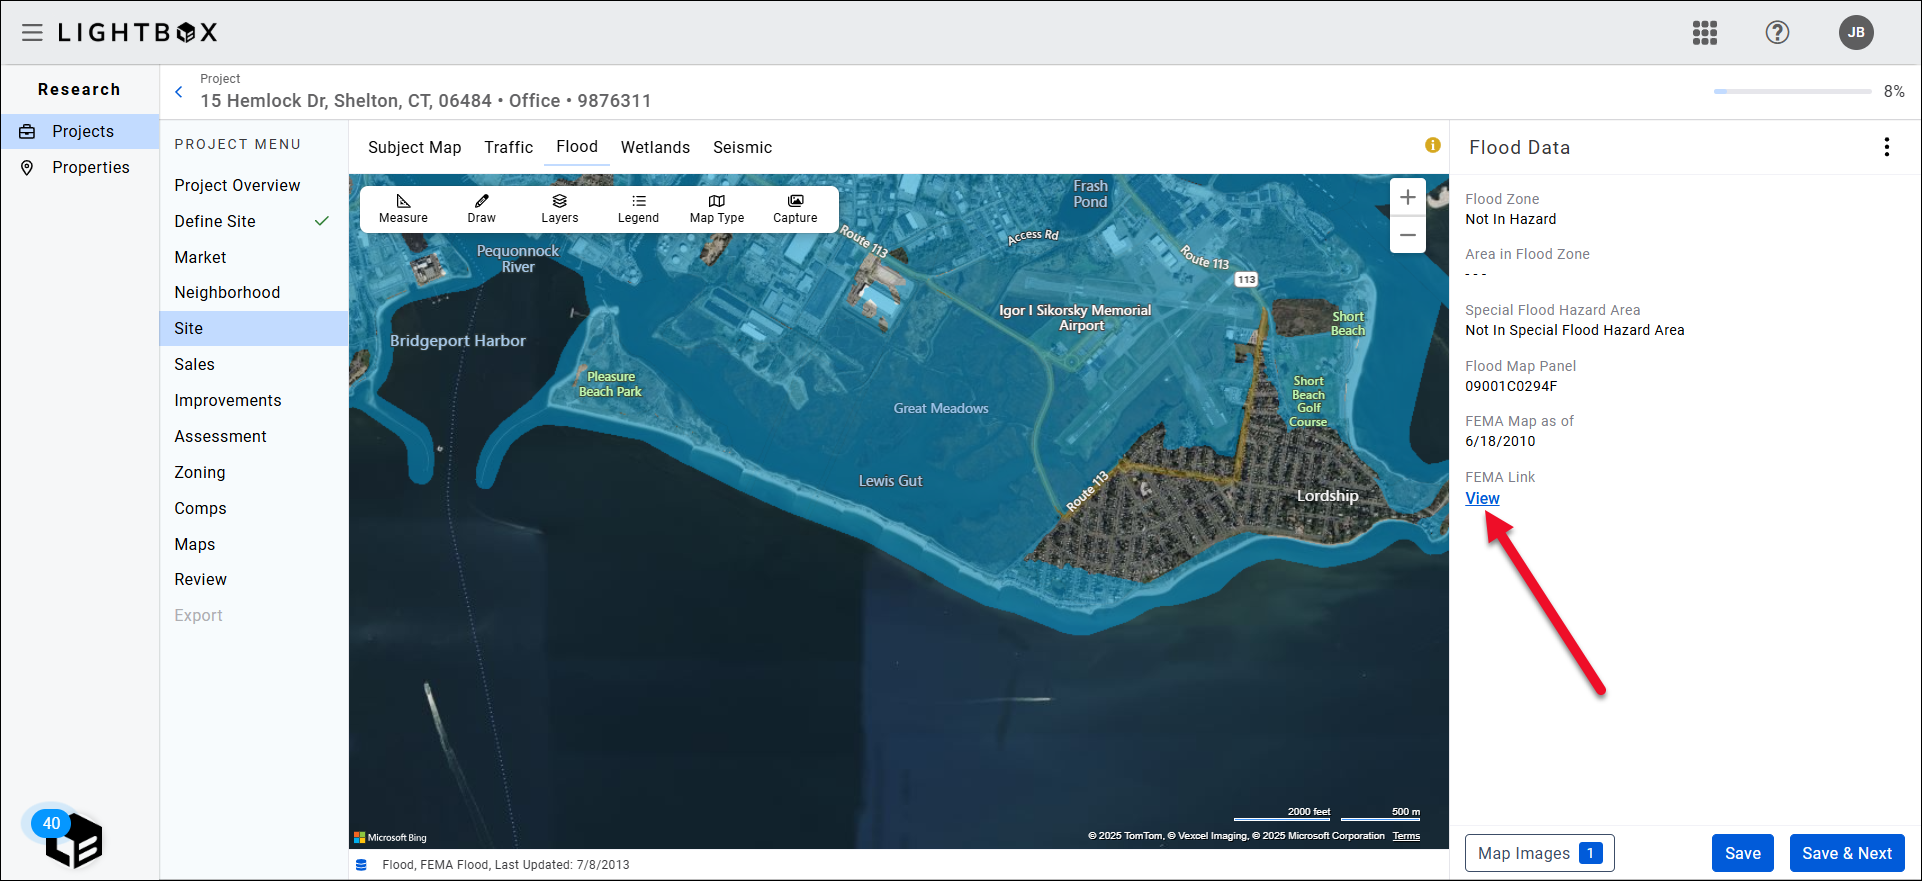
The Flood layer data is provided by FEMA. If the subject property site intersects two or more different flood zones it will display the worst.
The Wetlands layer is also available for display on the Flood exhibit.
Click the blue View link under FEMA Link to open the FEMA website and verify the values provided by the Research application.
.png)
Flood - Area in Flood Zone
The Area in Flood Zone field automatically calculates the percentage of the site, if any, in a flood zone.
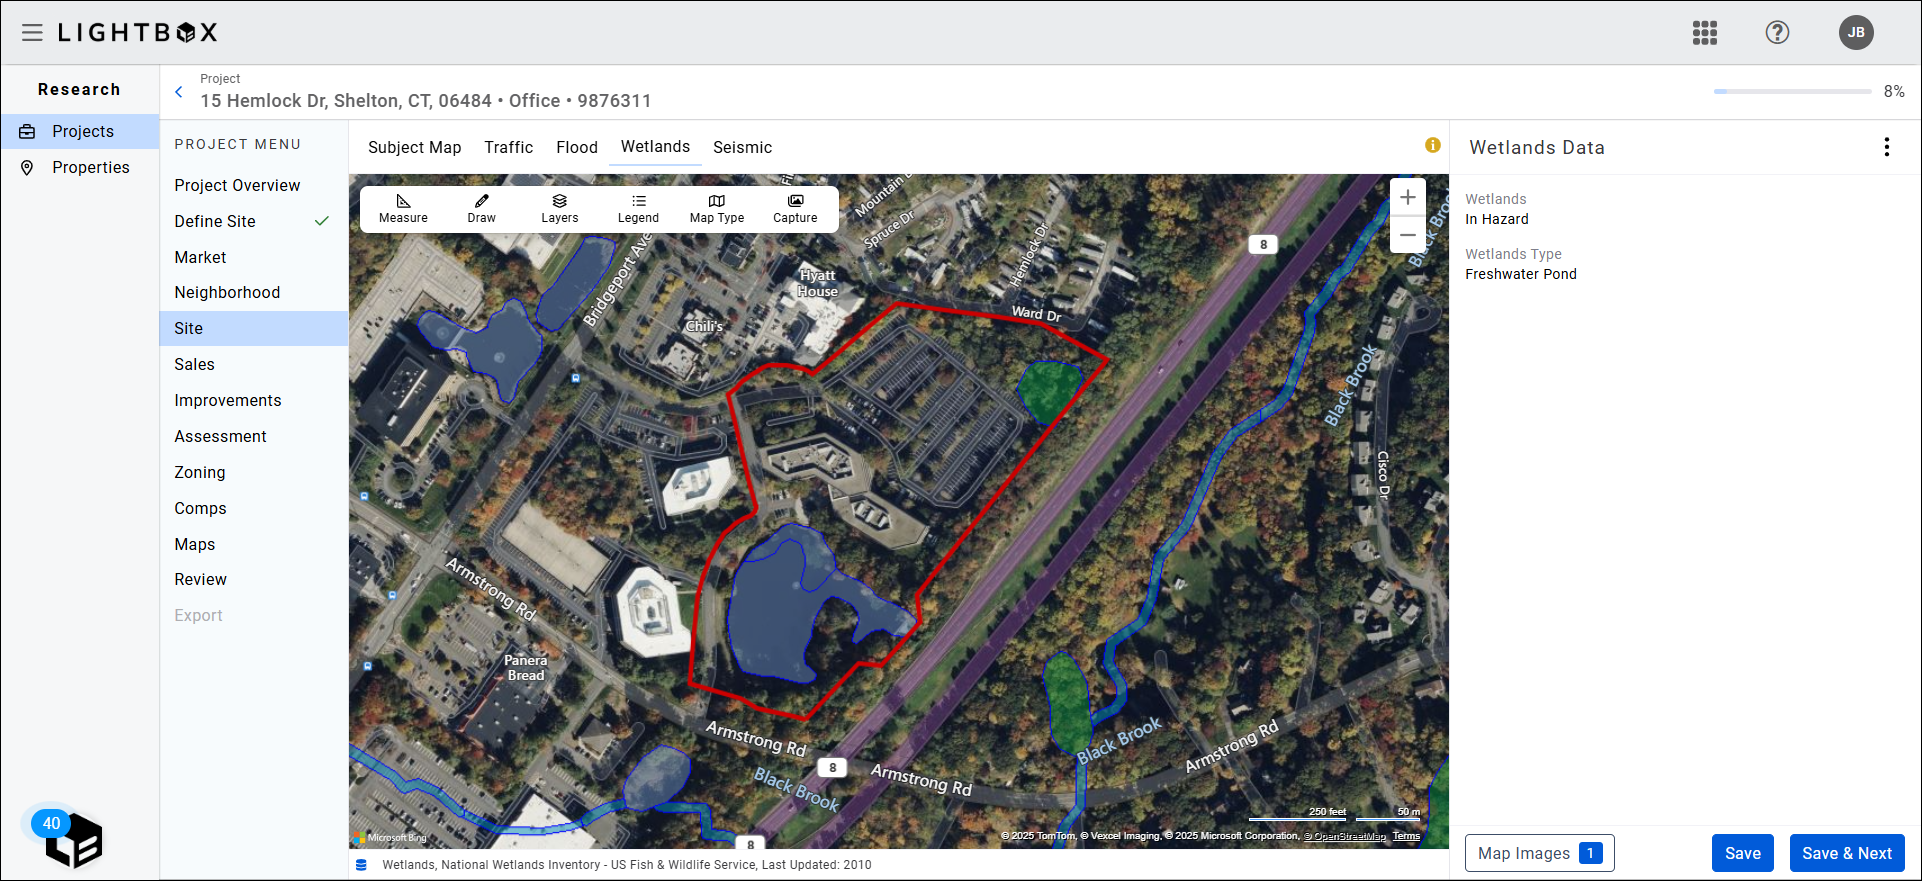
Wetlands
Wetlands data is provided by the US Fish and Wildlife Service’s National Wetlands Inventory.
Seismic
The Seismic exhibit is a thematic map that displays seismic risk zones and fault lines. Click the Legend button in the toolbar to display a legend.
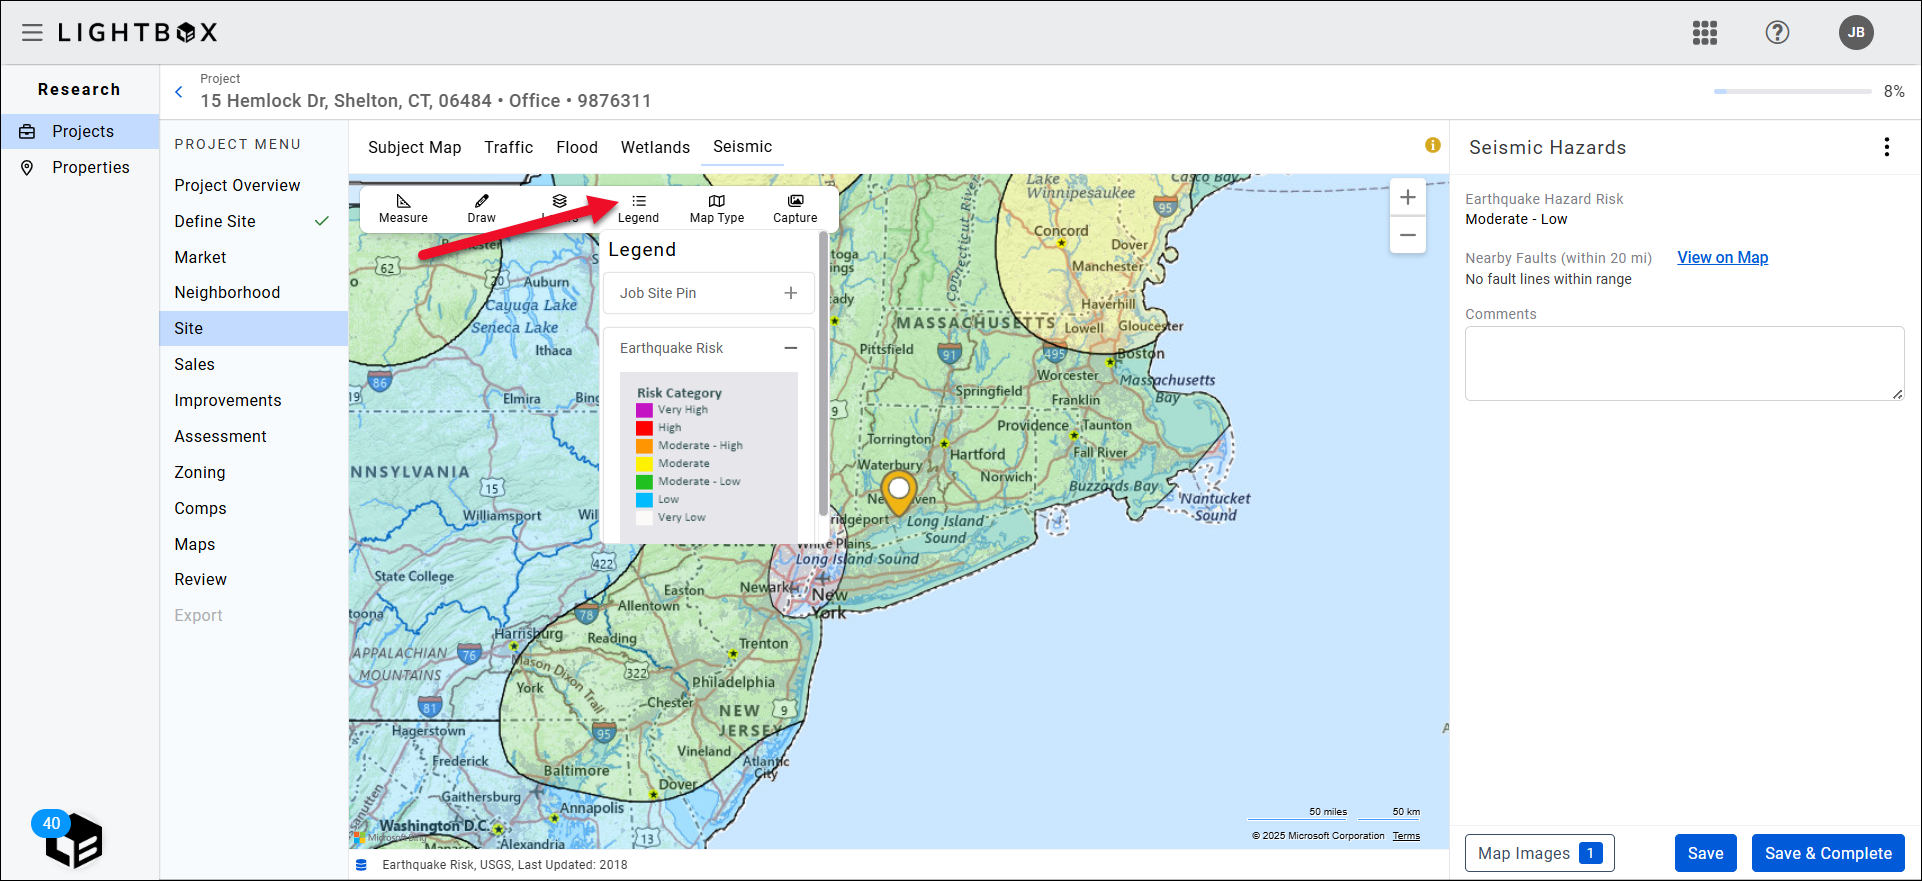
In addition to the map, a list of fault lines within 20 miles is displayed in the panel on the right. If there are no fault lines present within 20 miles, a message states “no fault lines within range.”
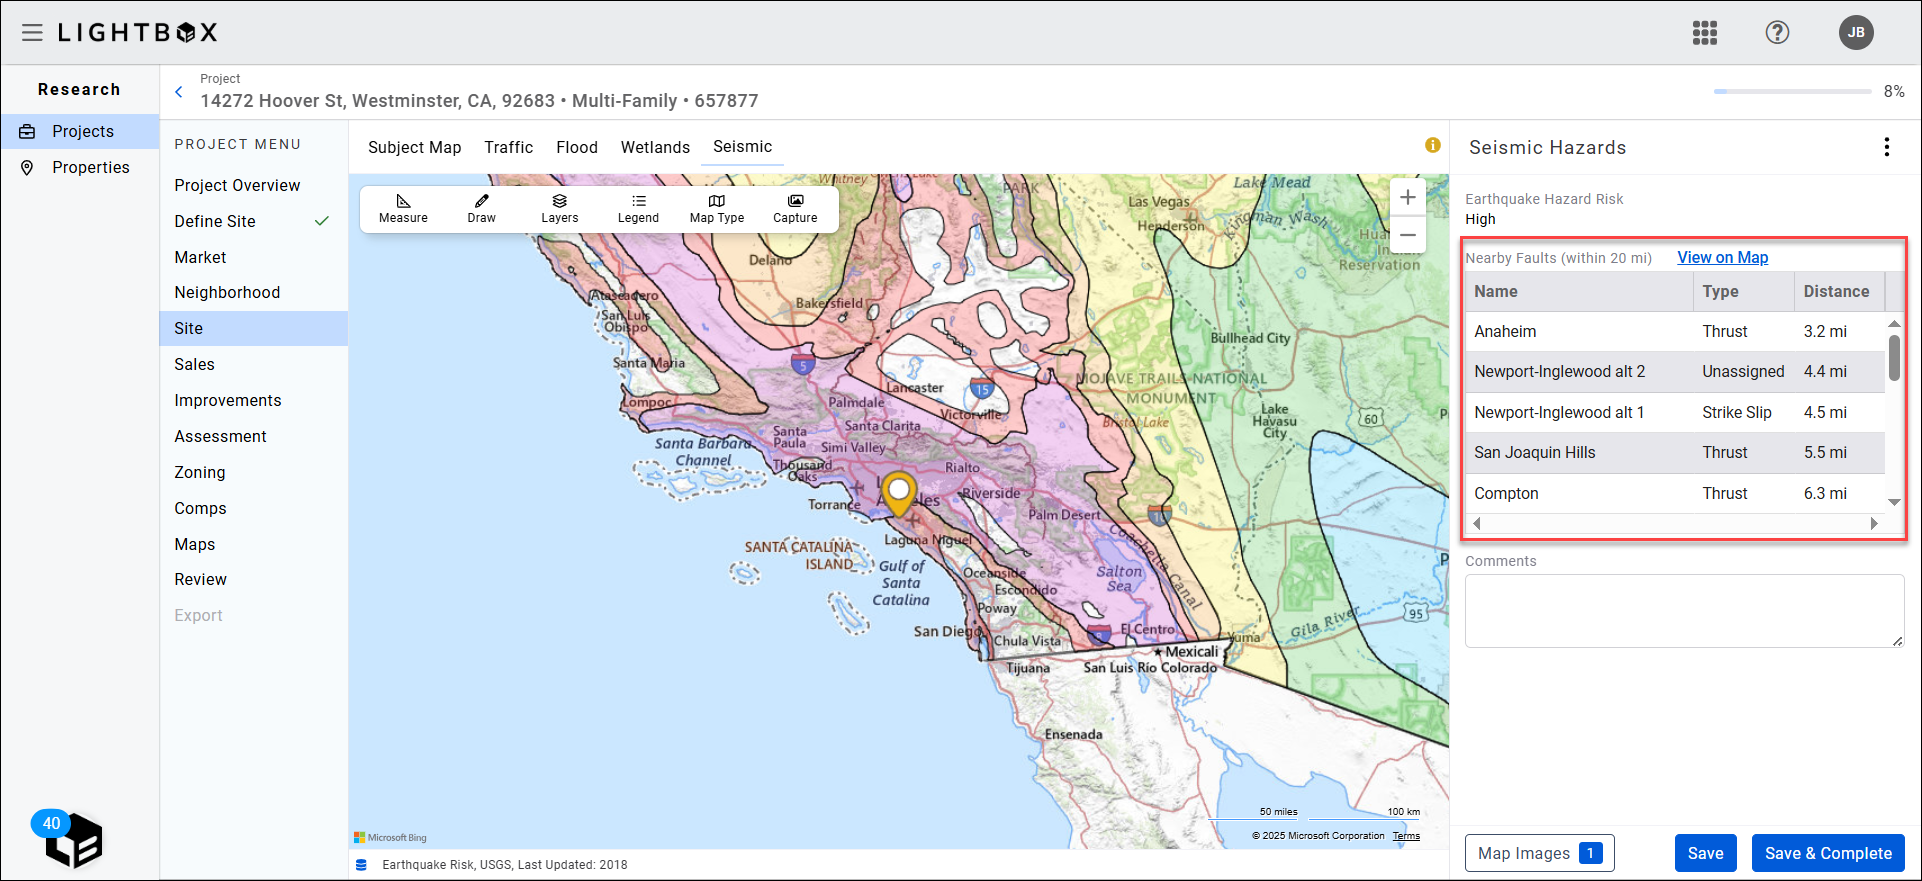
Toggle the fault lines on/off by clicking View on Map. Hover over a fault line on the map to display a tooltip with the fault’s name.
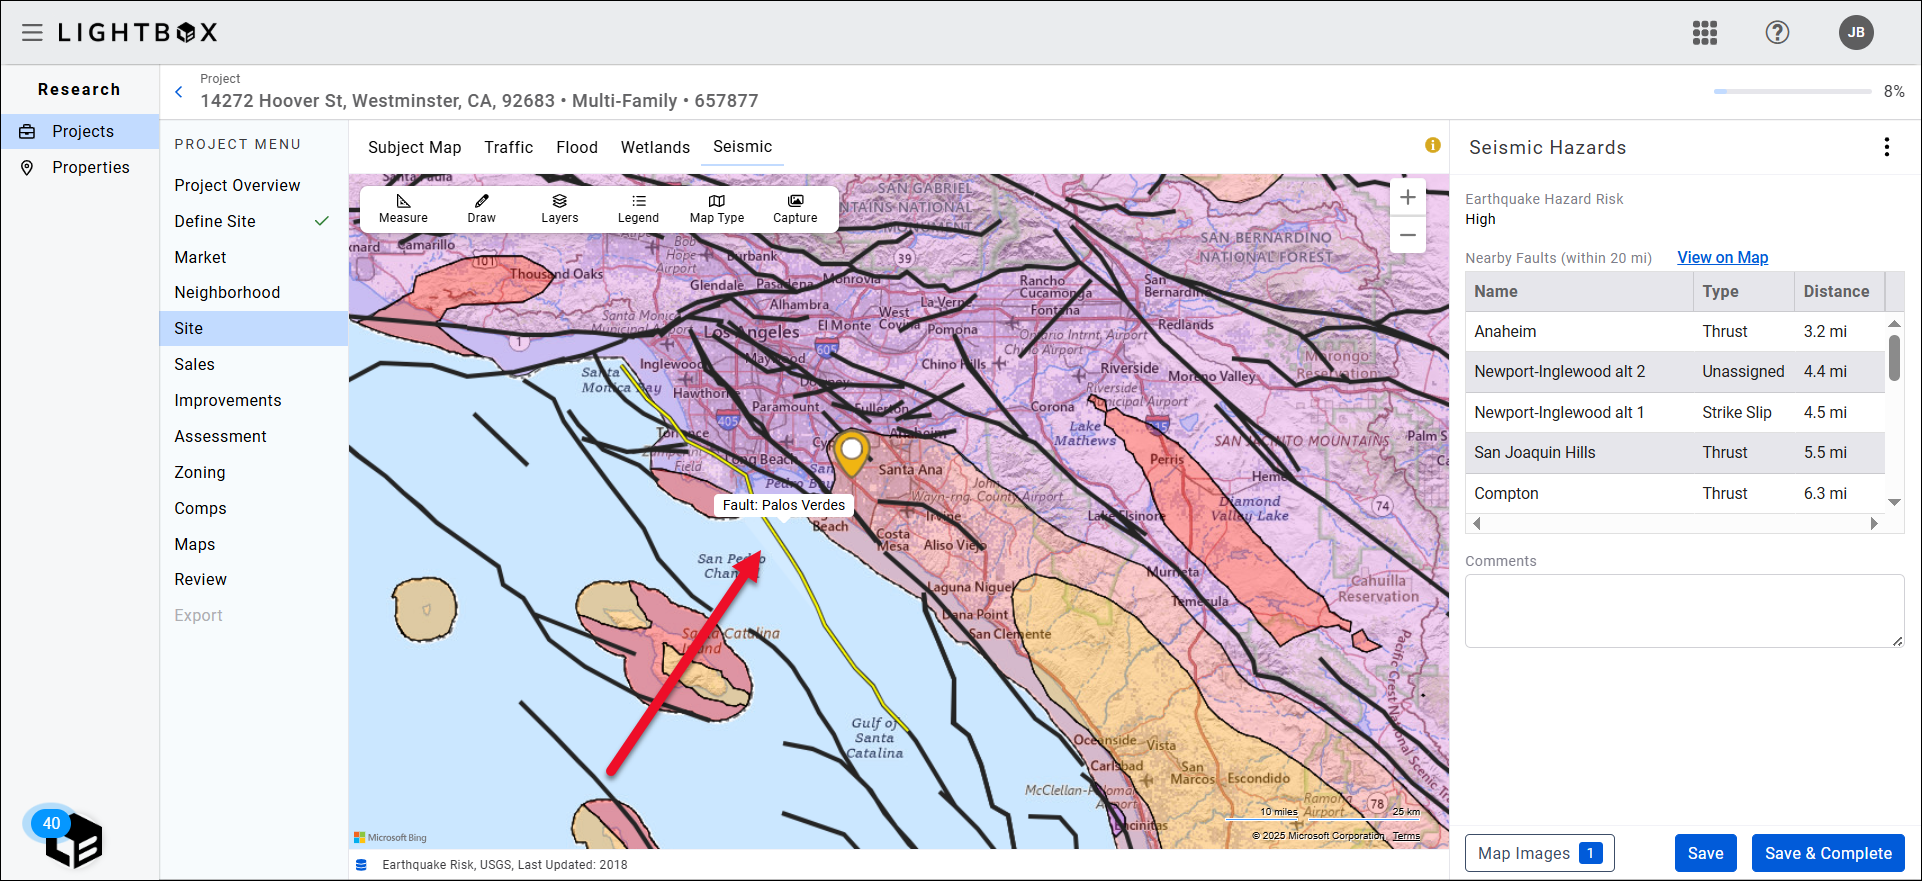
Seismic data is derived from the USGS.
Traffic
Traffic data is provided by AADT and the US DOT.
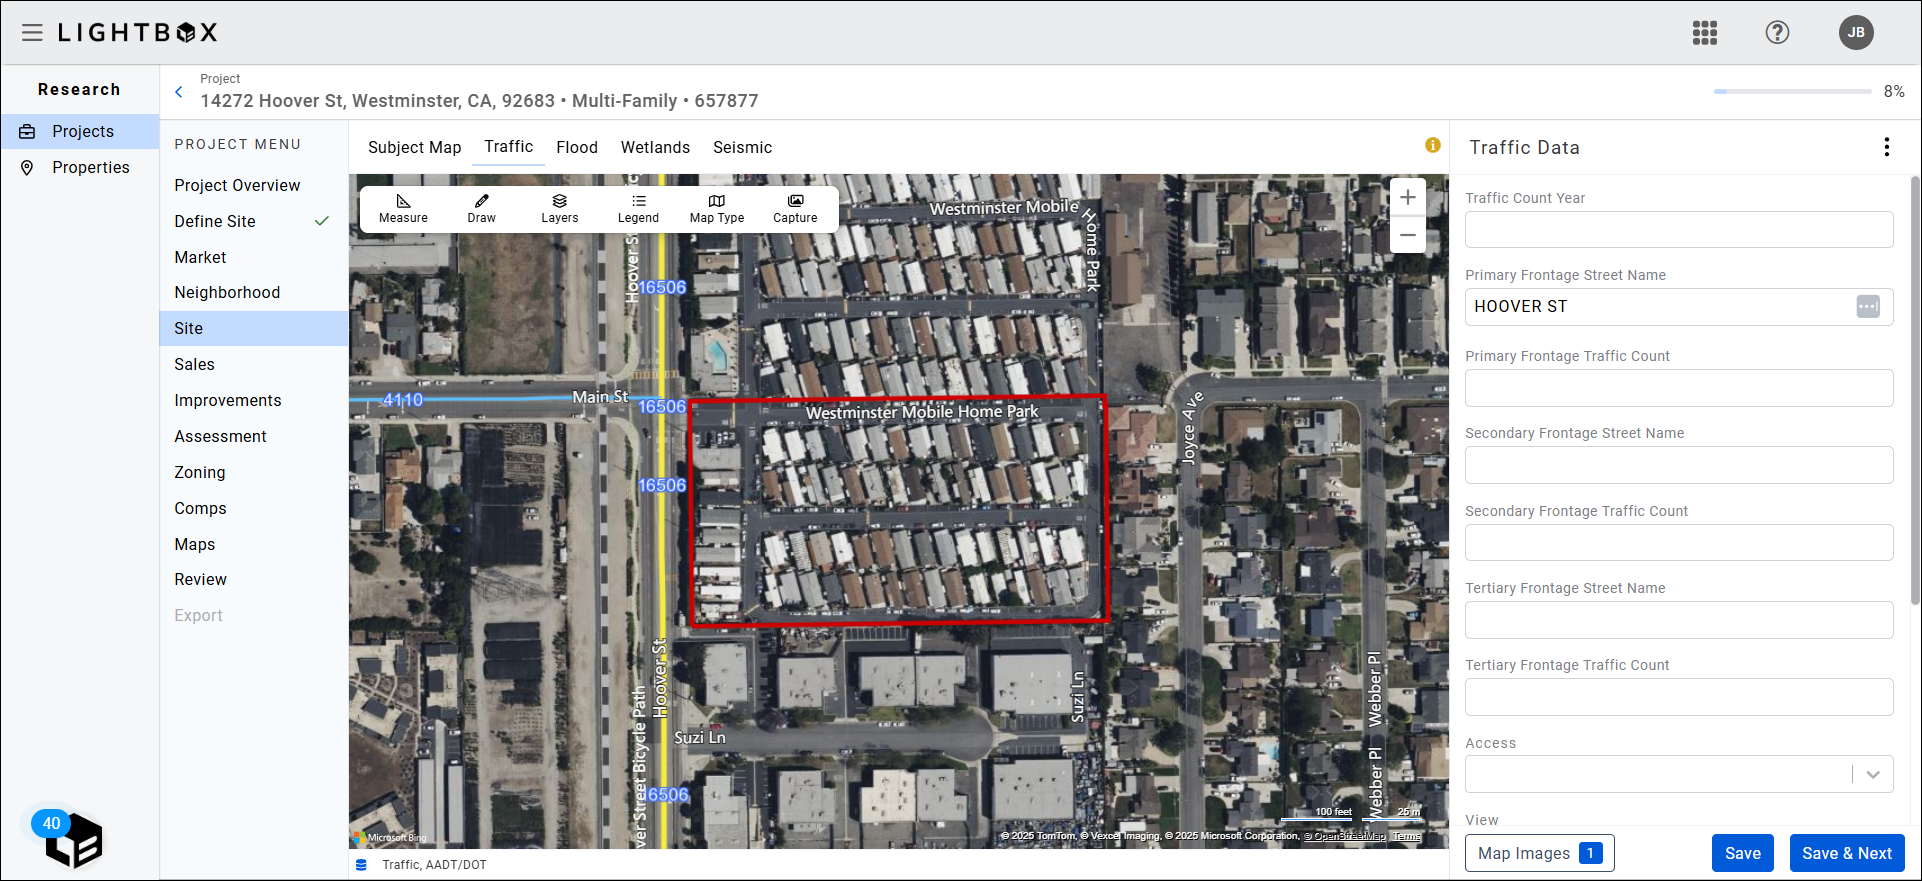
Values entered in the Primary Frontage Street Name, Secondary Frontage Street Name, and Tertiary Frontage Street Name fields populate the corresponding fields in the Subject Map exhibit. The reverse is also true: values entered in those fields in the Subject Map exhibit will populate the corresponding fields in the Traffic exhibit.
Note: The Traffic exhibit uses the 2017 U.S. DOT data set because it is the most robust, covering more streets than other years of Traffic data.
Was this article helpful?