Performance Monitor Module
- Print
- DarkLight
- PDF
Performance Monitor Module
- Print
- DarkLight
- PDF
Article summary
Did you find this summary helpful?
Thank you for your feedback!
The Performance Monitor module allows the user to view company performance over time, comparing against previous periods, as well as benchmark data provided by LightBox.
Defining Filters and Generating a Report
To access the Performance Monitor module, click on Performance Monitor in the left-hand navigation bar. When you first open the Performance Monitor module, the LightBox PM Default filter will be selected. You will have two different options to generate a new report: selecting from your previously saved reports or creating a new report.
Click Select Saved Report and then select a saved report to apply that set of saved filter criteria.
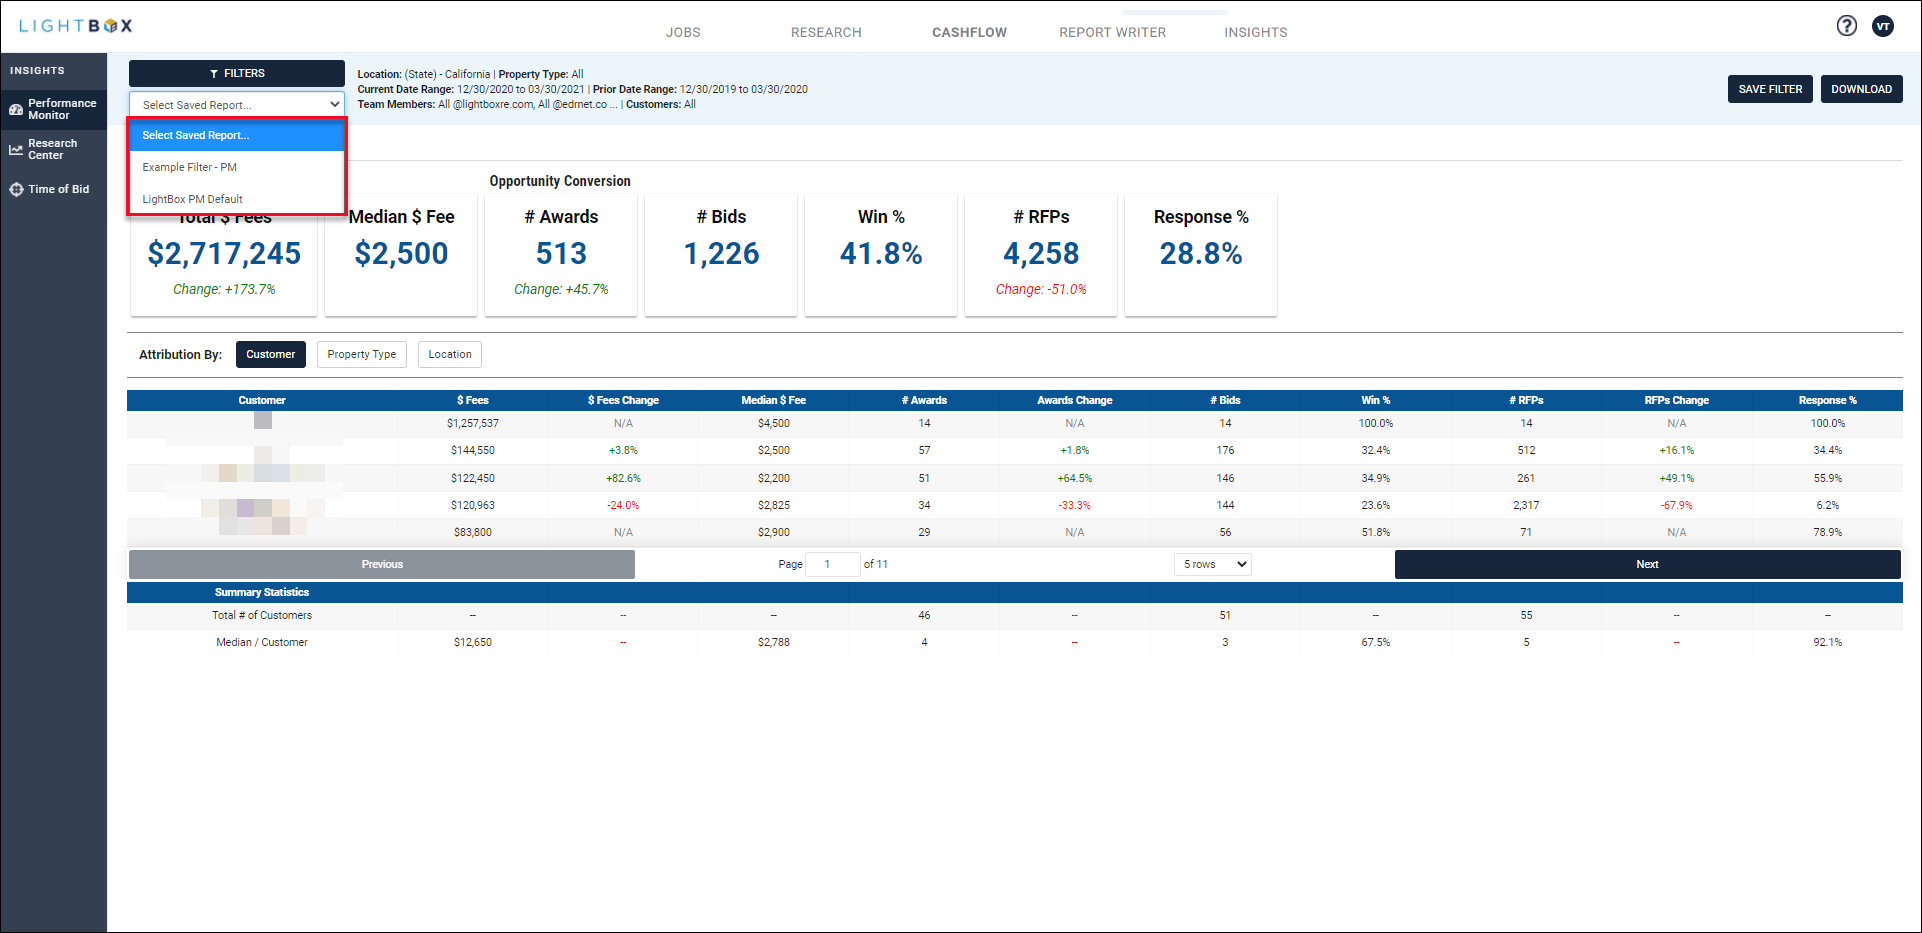
In the example above, there are two saved reports--LightBox PM Default and the user-created “Example Filter - PM.”
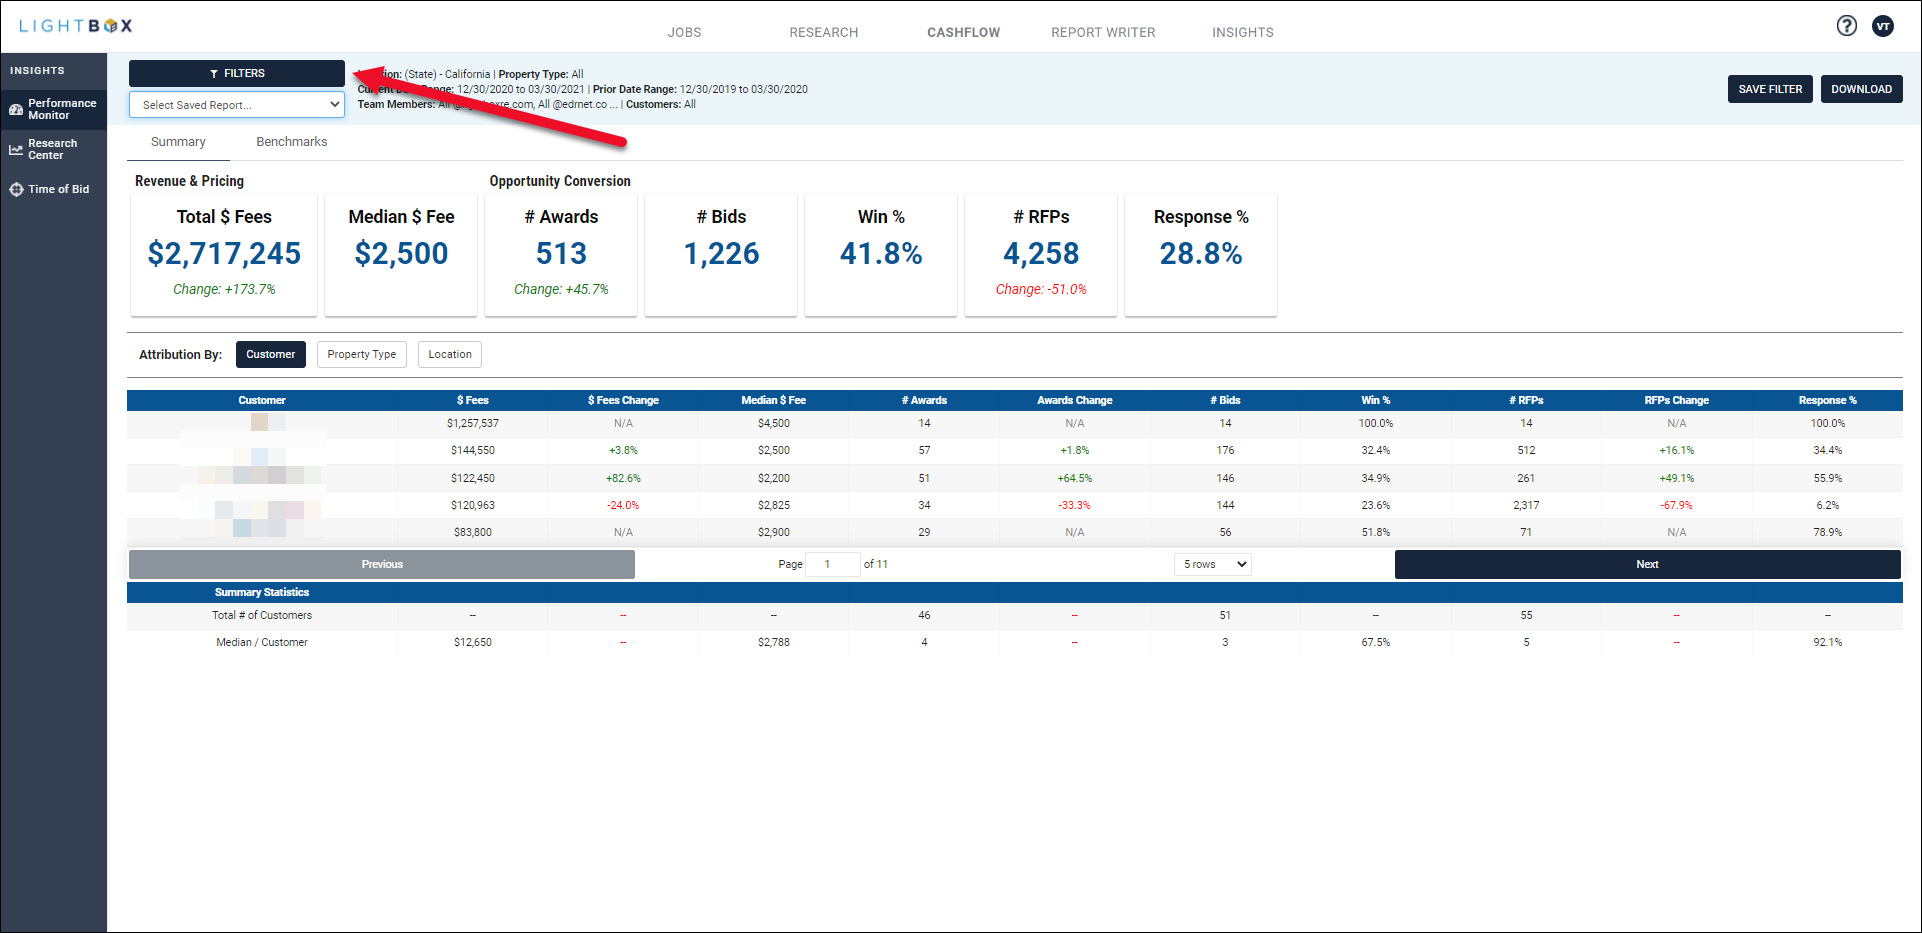
Click Filters to get started.
The Filter Controls modal opens.

A. Define Filters:
- Locations
- Property Types
- Current Date Range
- Prior Date Range
- Team Members
- Customers
Refer to Filter Details for additional information.
B. Optionally, click Reset Form in the upper right corner of the modal to reset all filters to their default settings.
C. Click Cancel in the lower right corner to close the Filter Controls modal. If a report was generated previously, the output from that report will be displayed when the Filter Controls modal closes.
D. Click Generate Report after the filters have been defined. The Filter Controls modal will close and the report data will be presented.
Viewing a Report
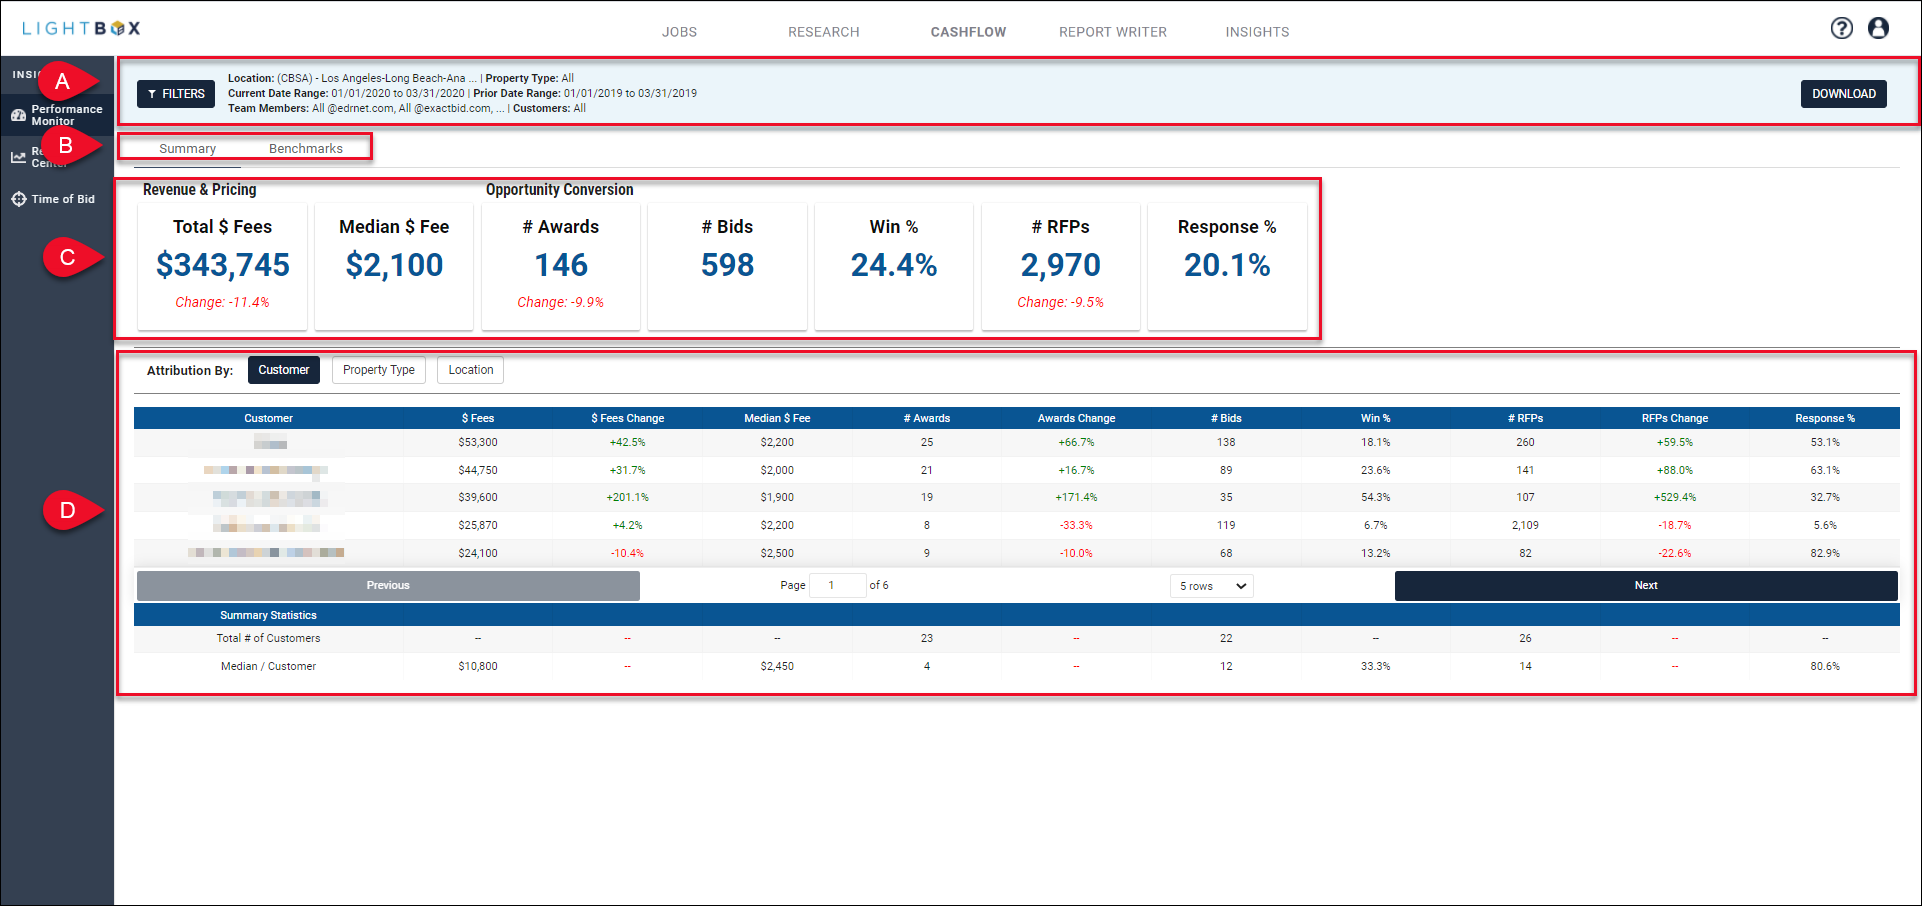
.png) The top of the output screen presents the user with summary information, three buttons, and a drop-down menu:
The top of the output screen presents the user with summary information, three buttons, and a drop-down menu: 
a. Click Filters to reopen the Filter Controls modal.
b. View report name and filter parameters.
c. Select a Saved Report.
d. Click Save Filter to create a new Saved Report.
- A pop-up will appear in the upper left corner of the page.
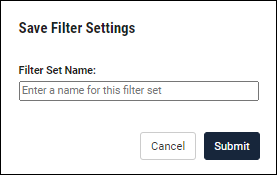
- Enter a Filter Set Name and click Submit to create a new Saved Report. Saved Reports that you create are not visible to other LightBox Valuation users. Note: Filter Set Names must be unique; attempting to create a new Saved Report with a Filter Set Name that already exists will return an error message.
e. Click Download to export an .xls file containing the report data. Refer to Download File section below for more information.
Note: The top section of the output is locked in place so that it will always be visible when scrolling between different data points.
.png) Click to navigate between the Summary Tab and Benchmarks Tab.
Click to navigate between the Summary Tab and Benchmarks Tab.
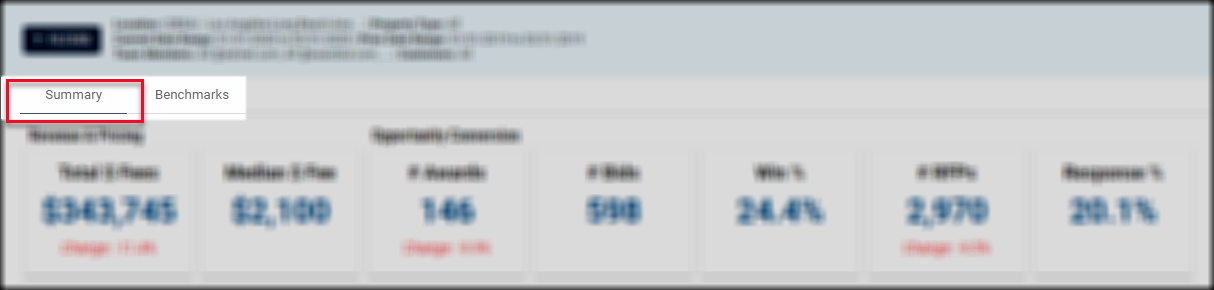
The Summary Tab displays your company’s performance for the current date range selected, with indicators of % changes versus the prior date range. Data provided includes:
- KPI Cards (item C below)
- Attribution Table (item D below)
.png) KPI Cards
KPI Cards
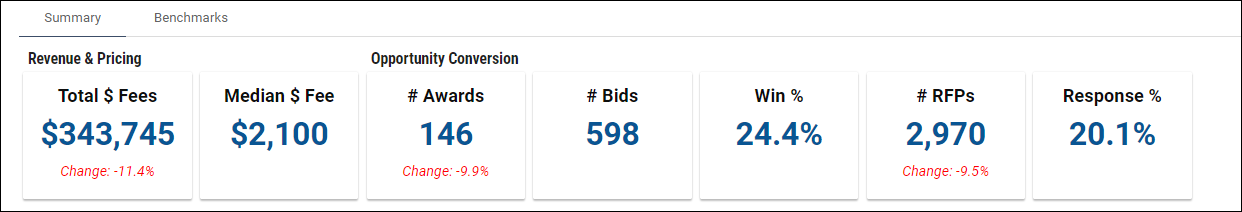
The Revenue & Pricing cards display the total fees you have earned in the current date range, along with the median price you have charged per individual assignment.
The Opportunity Conversion cards detail the number of assignments you were awarded, along with how many bids you made and the number of RFPs you received (along with implied % win rate and % response rate).
The KPI Cards are not visible when the Benchmarks tab is selected.
.png) Attribution Table
Attribution Table
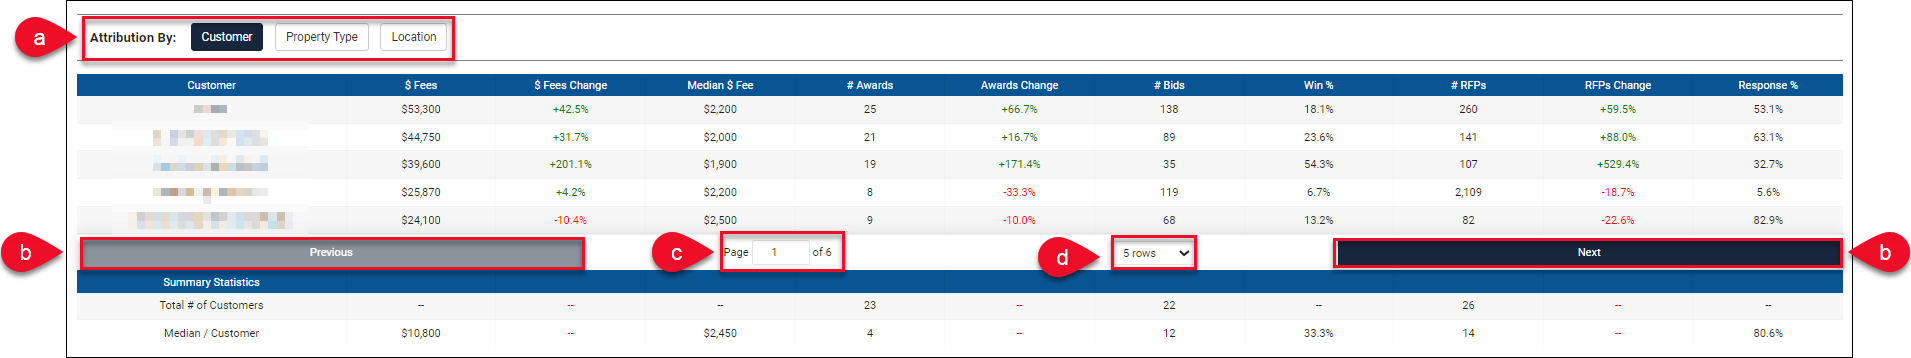
The Attribution Table breaks down your company’s performance in various dimensions to help you understand what areas are contributing to your results.
a. Click Customer, Property Type, or Location to display the data by that selection. For example, if Customer is selected, the $Fees data will be broken down by customer. If Property Type is selected, the $Fees data will be broken down by Property Type.
If Location is selected, you will have the option to break the data down by State, CBSA, or County.
b. Click Next and Previous to navigate between pages.
c. Jump to a specific page by entering a page number. Click the up/down arrows or simply input a number and press Enter on your keyboard.
d. Five rows are displayed by default. To change the number of rows displayed, click the drop-down menu below the table and make a selection.
The Attribution Table is not visible when the Benchmarks tab is selected.
The Benchmarks Tab displays your company data side-by-side with the corresponding LightBox benchmark data for comparison.
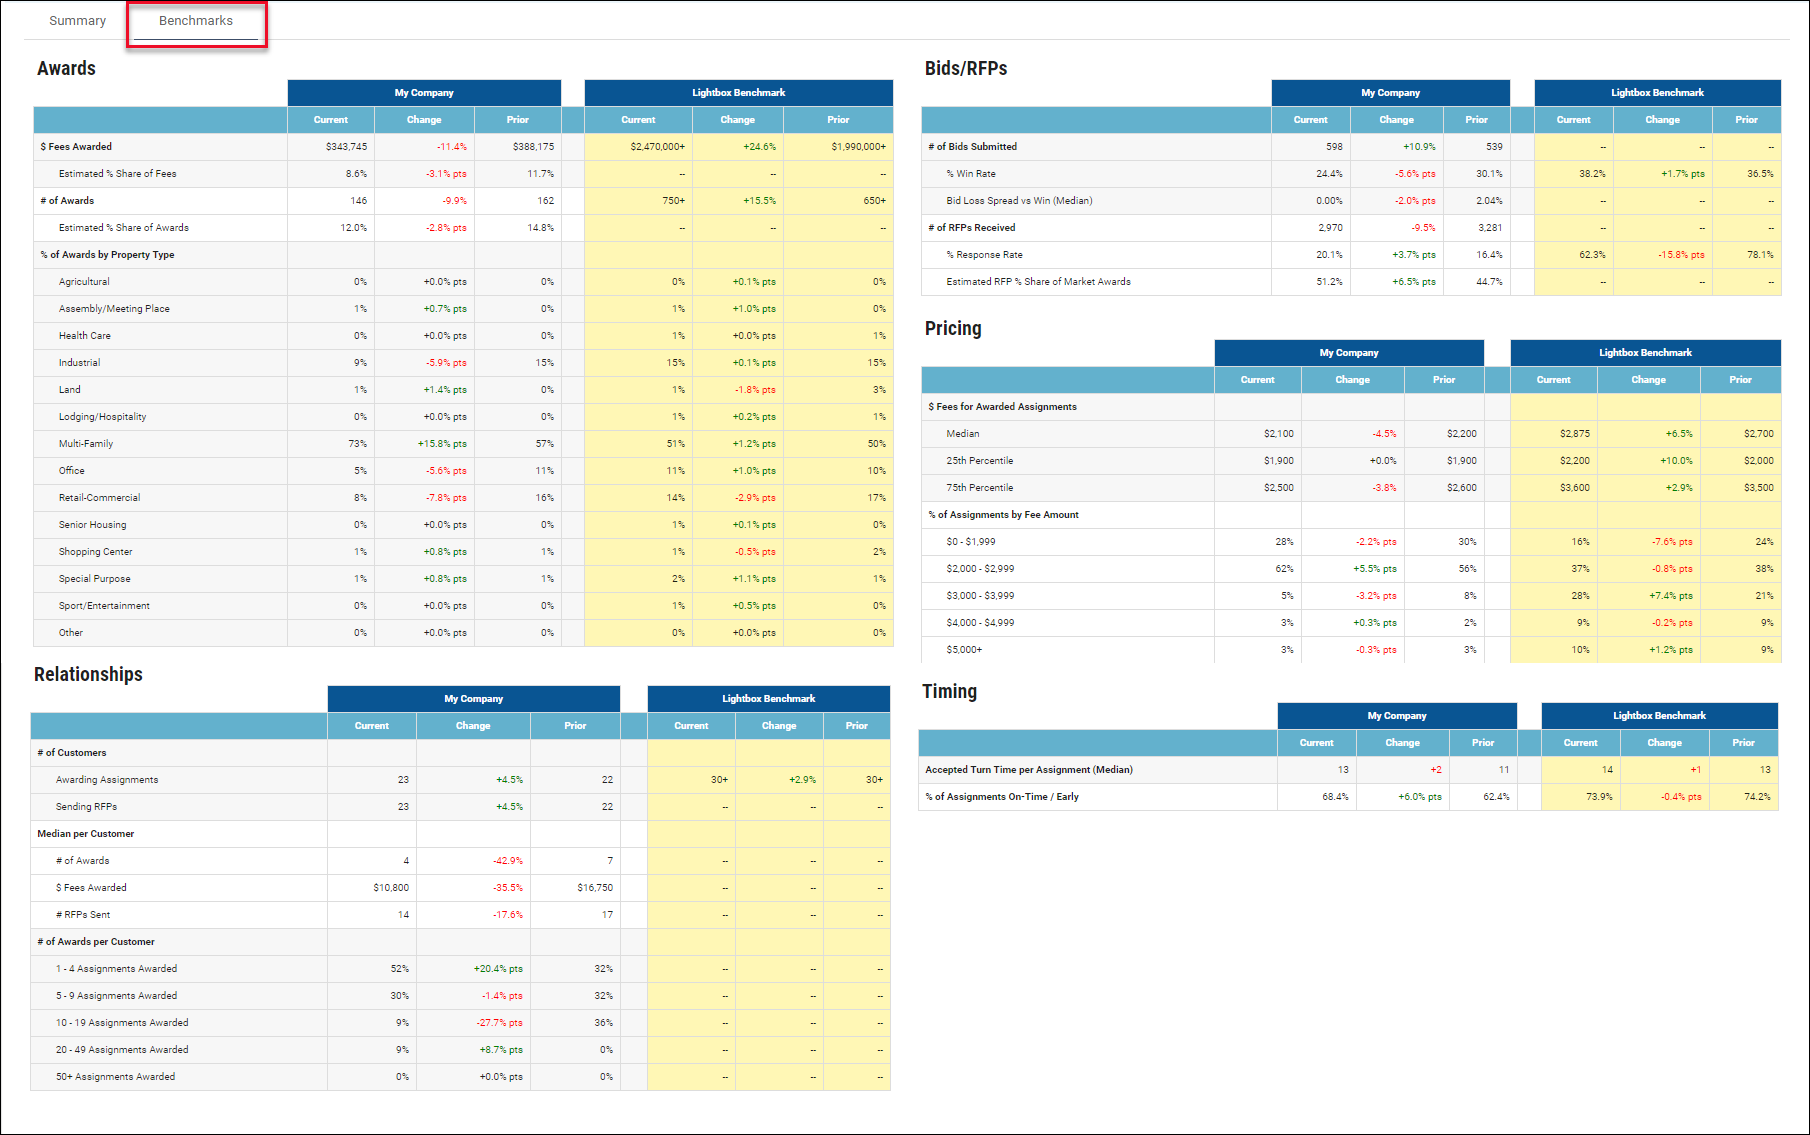
Data provided includes:
- Awards
- Bids/RFPs
- Pricing
- Timing
- Relationships
Download File
You can download report information, including parameters and output statistics, in .xls format for further manipulation. The .xls document includes the following four tabs:
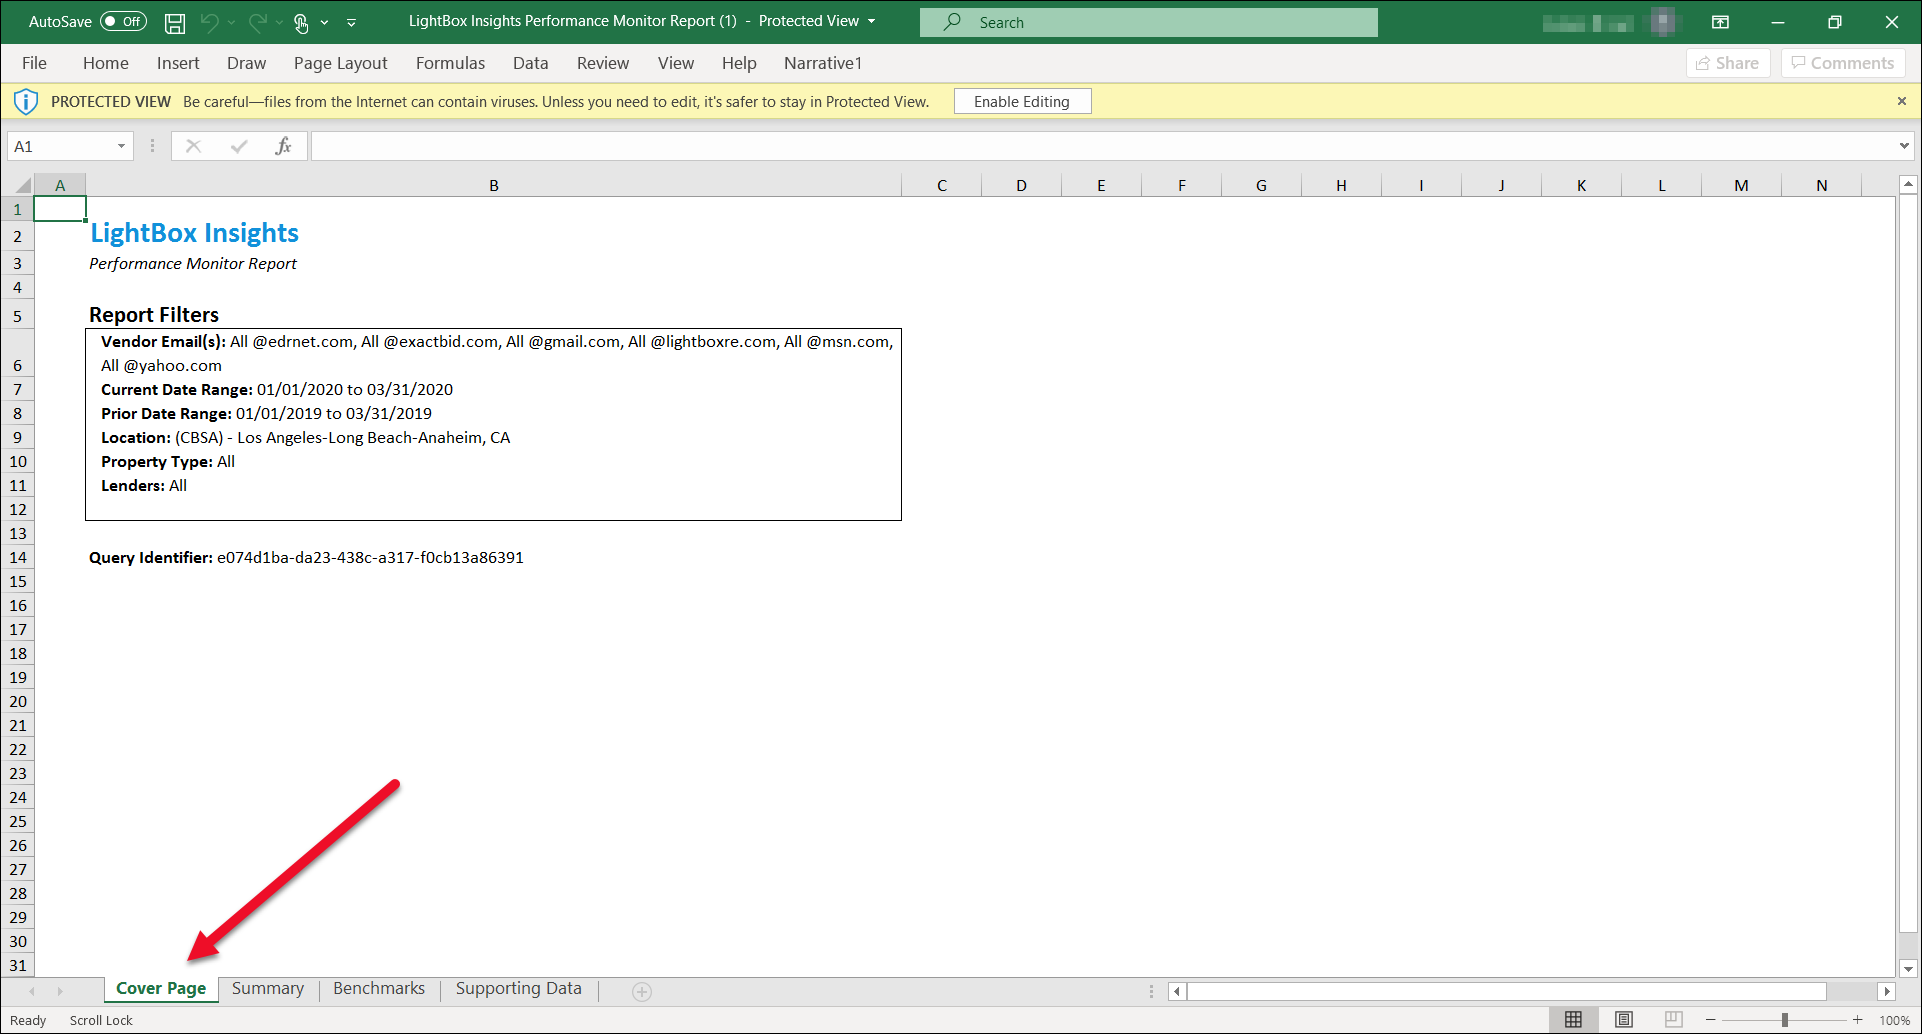
- Cover Page: Provides report filter information.
- Summary: Lists all of the data found on the Summary tab, such as $Fees Change, # Bids, and #RFPs.
- Benchmarks: Lists all of the data found on the Benchmarks tab.
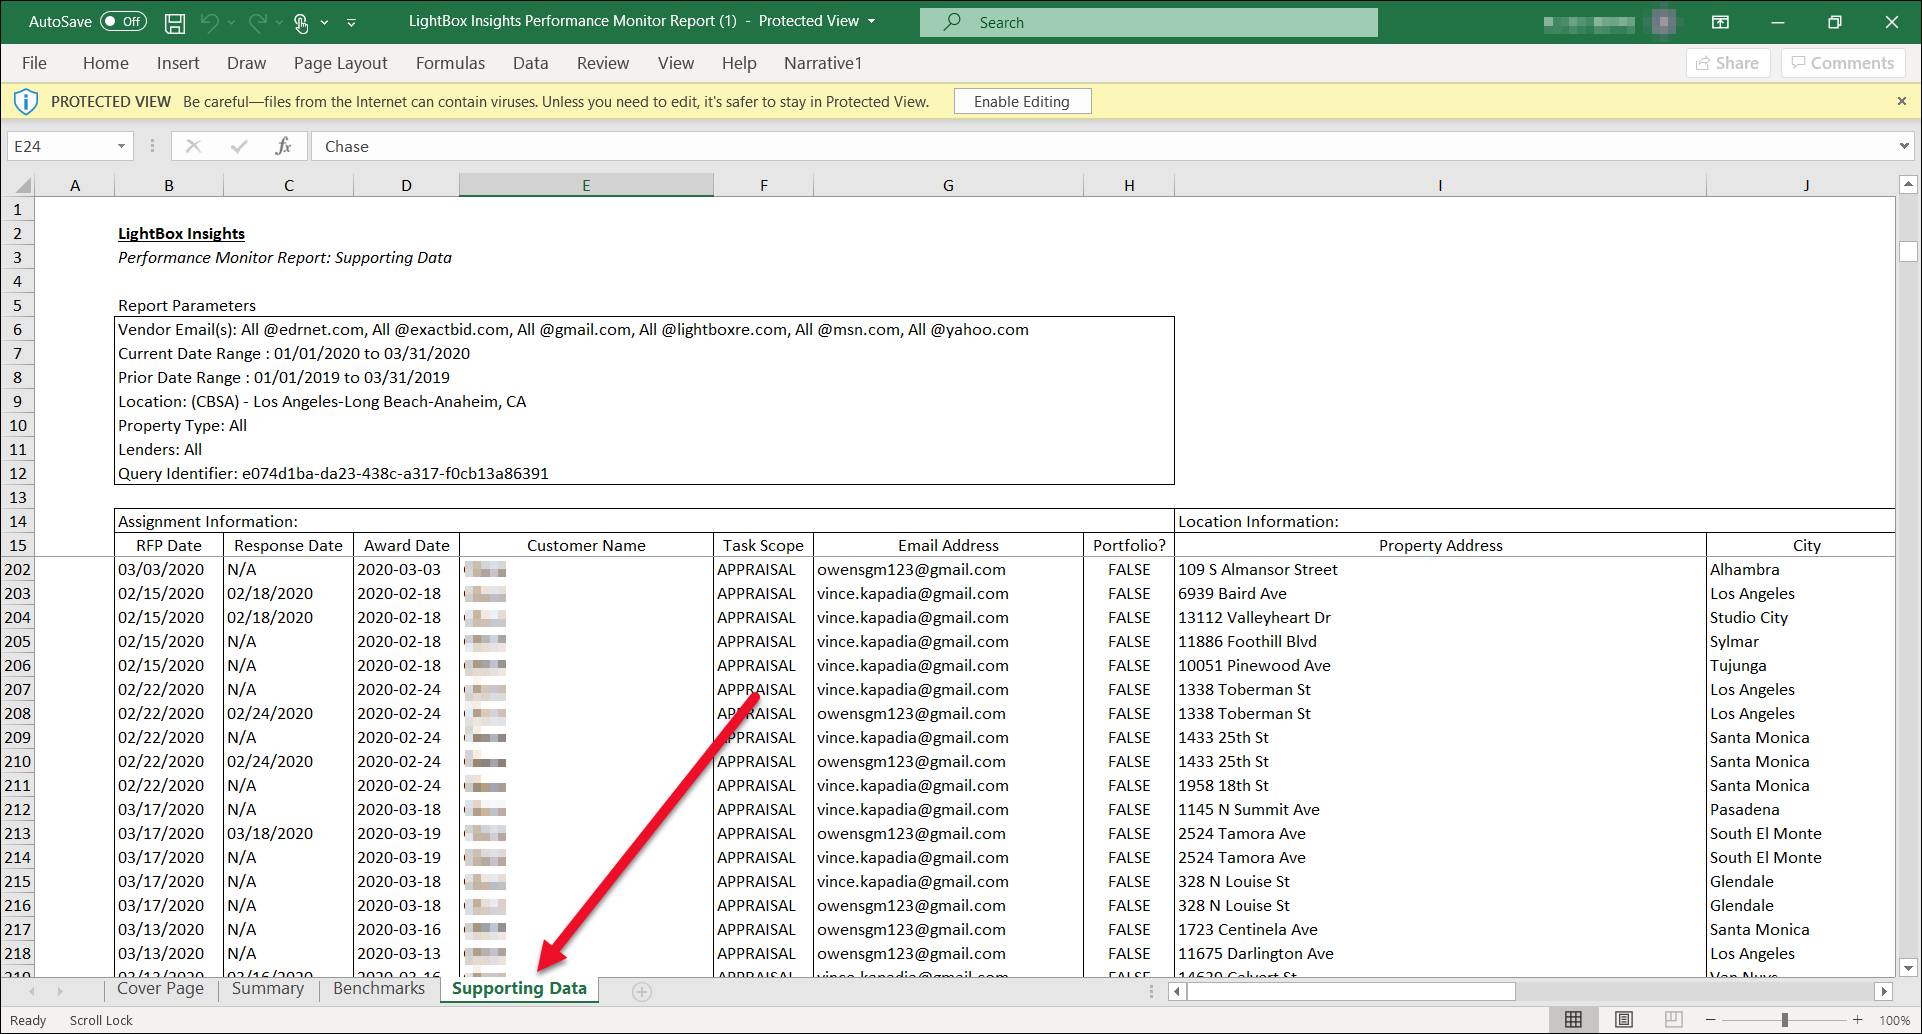
- Supporting Data:Lists the underlying data set (records for each RFP) that statistics from the Summary and Benchmarks tabs are generated from. Note this list includes the current date range only.
Cover Page:
Summary: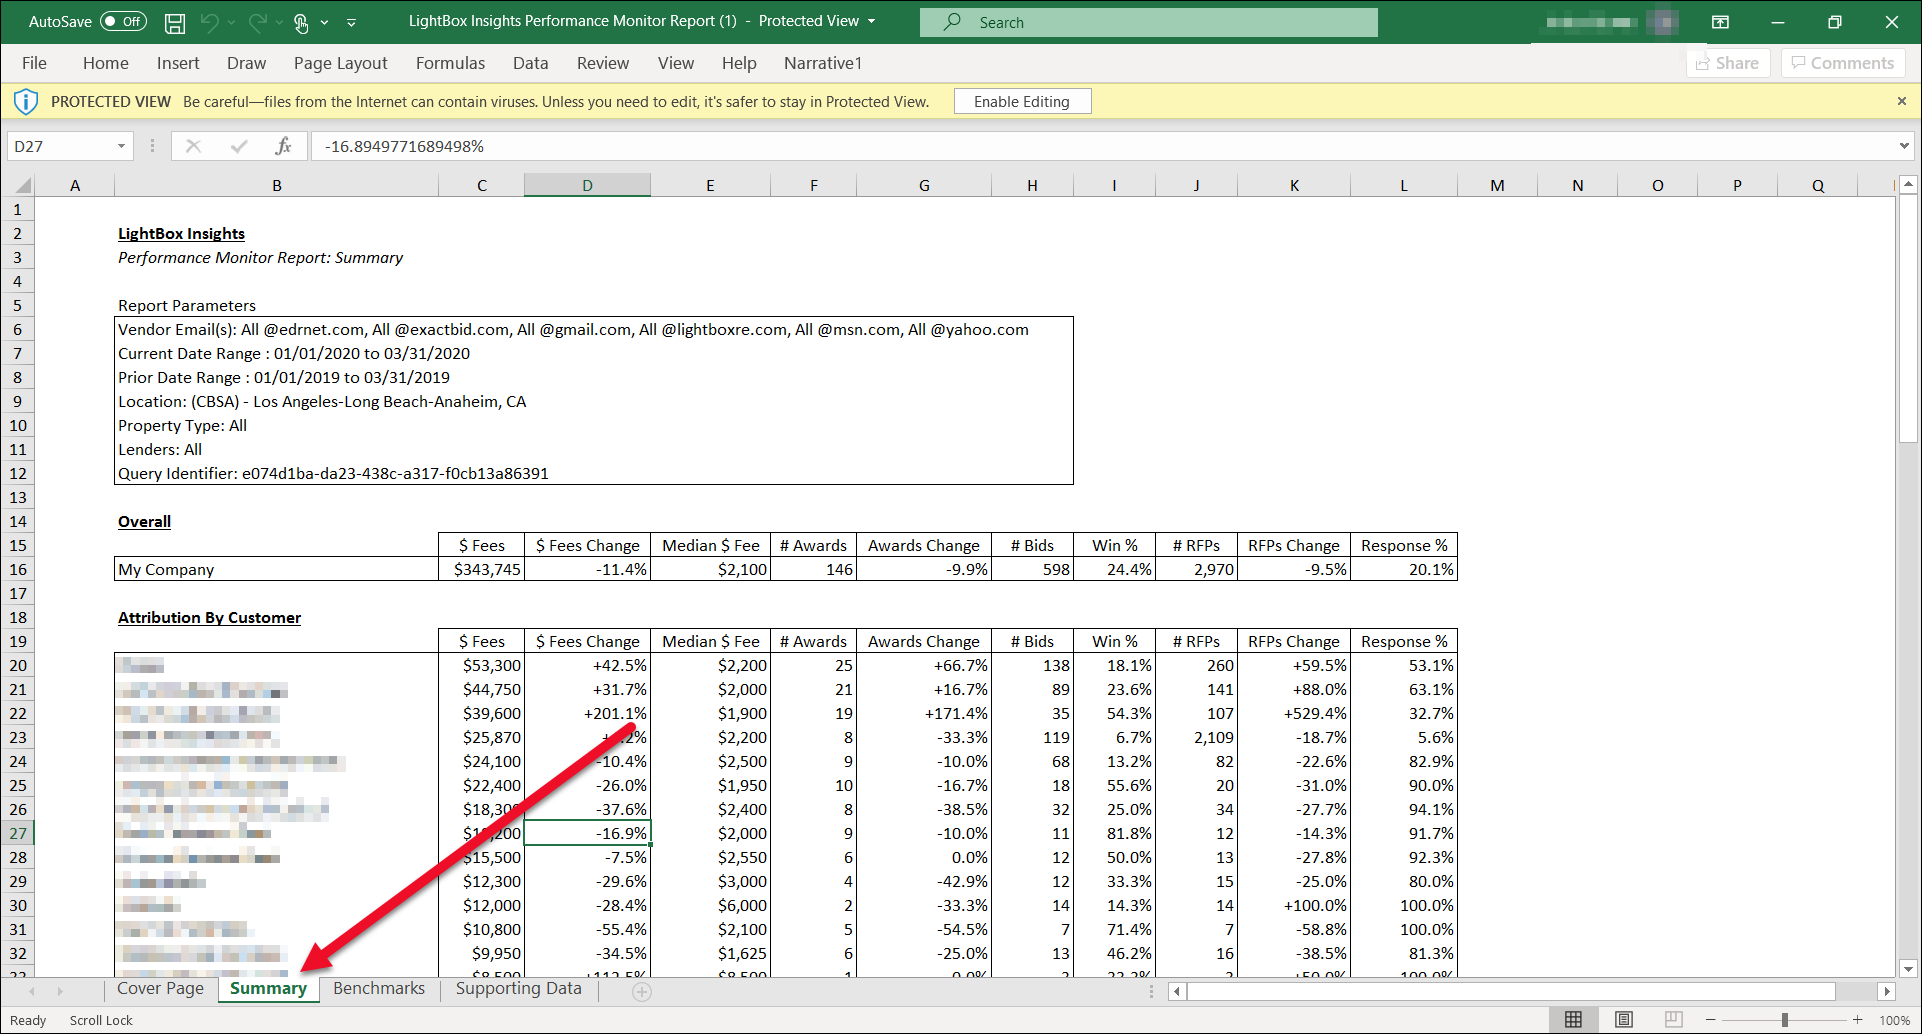
Benchmarks:
Supporting Data:
Filter Details
Queries can be made with six filters:
- Locations
- Property Types
- Current Date Range
- Prior Date Range
- Team Members
- Customers
Each filter has a default setting and hierarchy of additional selections that can be made. Individual filter details are provided below.
Locations
Select the geographic area on which to query.
.png)
A. Locations: Select all locations (default setting). This is equivalent to a national query.
B. State: Select one or more states.
- To enable state-level selection functionality, you must first uncheck the default Select all State and Locations filter selection. Until that box is unchecked, the state-level selection area will remain grayed out and you will not be allowed to click on it, see drop-down lists, etc.
C. Location Type: Select one or more of EITHER CBSAs (CBSA = “Core Based Statistical Area”, parallel to a metro area) OR counties WITHIN the selected state(s). You cannot include a combination of CBSAs and Counties in a single report.
- To enable the Location Type functionality, select at least one state from the State selection box.
- Select either CBSA or County from the Location Type drop-down menu.
- Once a location type has been selected, a CBSA or County drop-down menu will appear to the right of Location Type.
.png)
Select one or more CBSAs or Counties. Available selections are determined by the CBSAs/counties associated with the selected state(s).'
- Once a location type has been selected, a CBSA or County drop-down menu will appear to the right of Location Type.
Property Types
Select the classification of the underlying property on which to query. Insights uses a list of Property Types and Sub Types sourced from RIMS, which based its classification on the Appraisal Institute’s taxonomy. We have not updated our classification for the 2019 changes to the AI taxonomy.

A. Select All Property Types to select all property types (default setting).
B. Property Type: Select an individual Property Type.
- To enable Property Type-level selection functionality, you must first uncheck the default Select all Property Types filter selection. Until that box is unchecked, the Property Type-level selection area will remain grayed out and you will not be allowed to click on it, see drop-down lists, etc.
C. Property Sub-Type: Select one or more Property Sub-Types.
Current Date Range
Select the time period to query on.

A. Make a selection in the Current Date Range section. The selection made here will determine what options are available in the From/To drop-down menus.
- Year(s): Select a From year and To Select the same year in both drop-down menus to include a single year.
- Quarter(s): Select a From quarter and To Select the same quarter in both drop-down menus to include a single quarter.
- TTM: Trailing twelve months. This locks the From and To drop-down menus.
- YTD: Year to date. This locks the From and To drop-down menus.
- 30 Days: This locks the From and To drop-down menus.
- 90 Days: This locks the From and To drop-down menus.
- 180 Days: This locks the From and To drop-down menus.
- Custom: Select specific dates in the From and To drop-down menus.
B. Make a selection, if appropriate.
Prior Date Range
Select the prior date range.

- Year over Year: Matches the selection made in Current Date Range, but for the previous year or period. Example: TTM is selected in the Current Date Range, providing a From date of 10/20/2019 and a To date of 10/19/2020. If Year over Year is selected in Prior Date Range, a From date of 10/20/2018 and a To date of 10/19/2020 will be populated.
- Sequential Period: A period of equal length occurring directly prior to the selection made in Current Date Range. Example: 2020 Q2 is selected in Current Date Range. If Sequential Period is selected in Prior Date Range, 2020 Q1 will be populated.
- Custom: Select a From and To date without constraints.
The selections made here drive the comparison field values in the data table. Example: If 2020 Q1 is selected in Current Date Range and 2019 Q1 in the Prior Date Range, the $ Fees Change field in the data table will display the percentage difference in fees, plus or minus, between 2019 Q1 and 2020 Q1.
Team Members
Select one or more team members within your organization to query on. “Team Member” is defined as an email address attached to an account within RIMSCentral and/or PARCEL that has been associated with a user’s organization in the Insights user administration site.

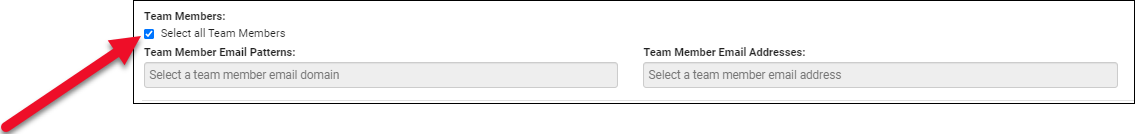
A. Team Members: Select all team members in your organization (default setting).
B. Team Member Email Patterns: Select one or more email domains belonging to vendors within your organization. Example: all @appraisalcorp.com
C. Team Member Email Addresses: Select one or more email addresses belonging to vendors within your organization. Example: michael@appraisalcorp.com, christina@appraisalcorp.com
- To enable Team Member Email Patterns and Team Member Email Address selection functionality, you must first uncheck the default Select All X Team Member Patterns and All X Addresses filter selection. Until that box is unchecked, the other Team Member filters will remain grayed out and a user will not be allowed to click on them, see drop-down lists, etc.
Customers
Click the Select a customer box to expose a drop-down menu listing your customers. Click on one or more customers to add them as filter criteria. The report will only include data from those customers. Note that LightBox market data will not change based on this filter selection.
.png)
Was this article helpful?