Neighborhood
- Print
- DarkLight
- PDF
Neighborhood
- Print
- DarkLight
- PDF
Article summary
Did you find this summary helpful?
Thank you for your feedback!
Neighborhood
The Neighborhood object includes three map exhibits for collecting information about the area surrounding the subject property: Neighborhood, School, and Crime.
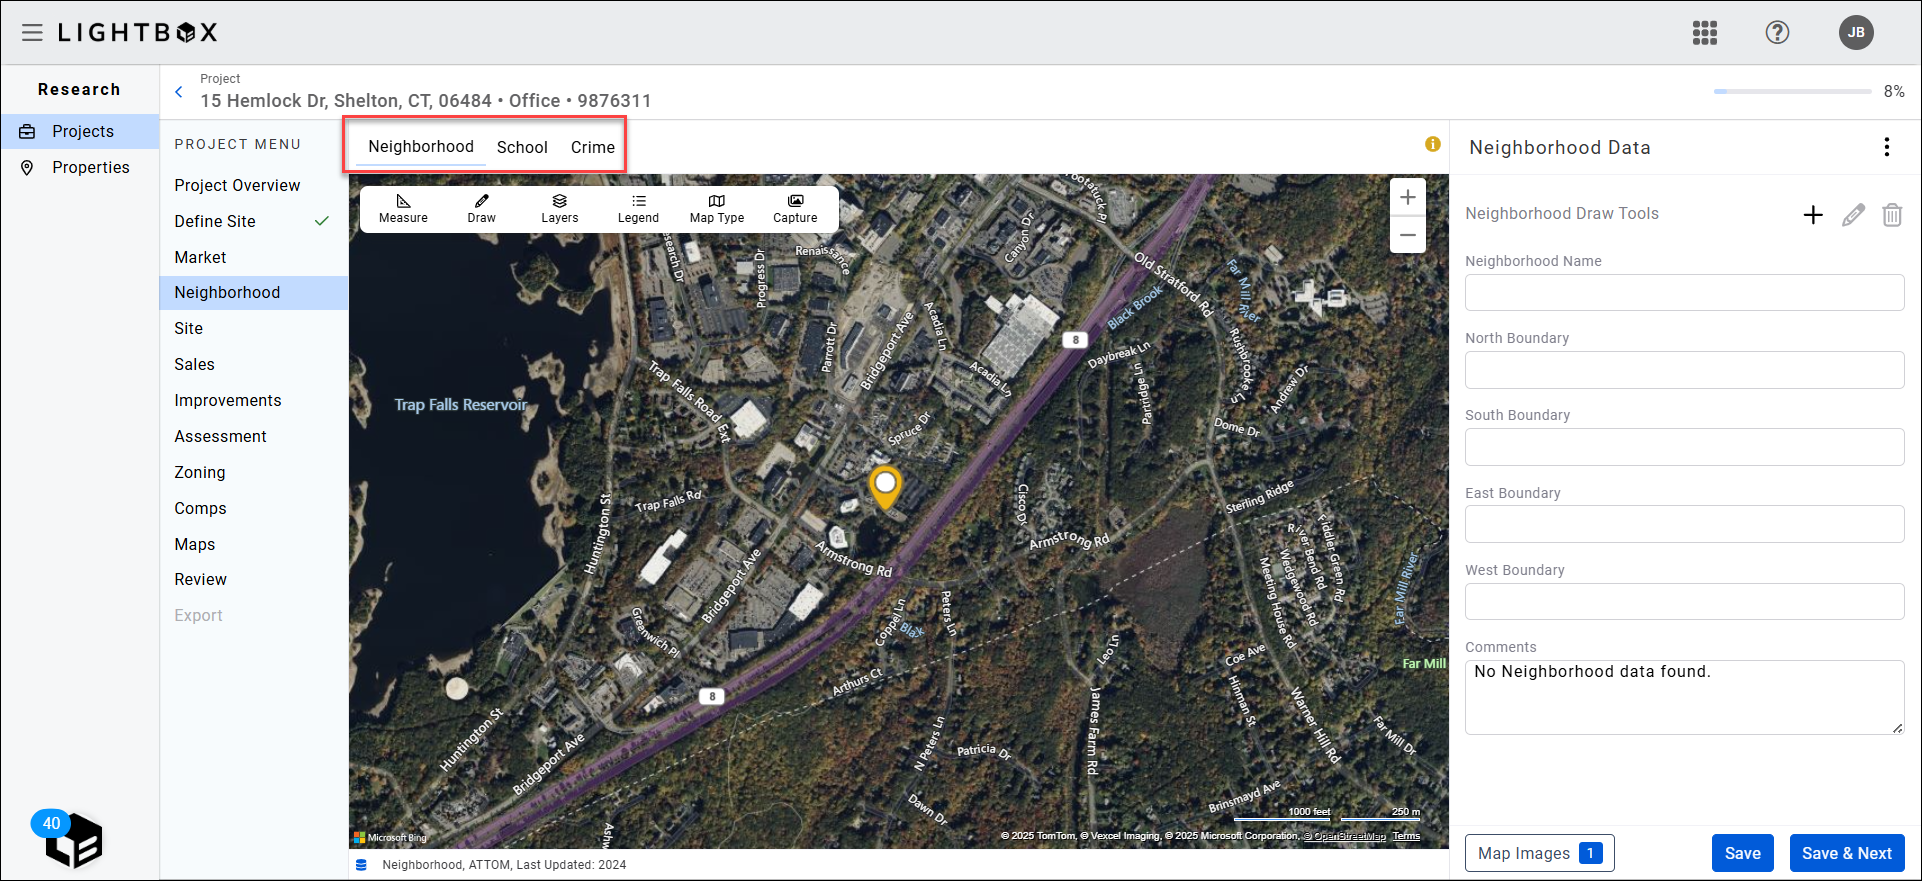
The Neighborhood exhibit provides drawing tools to define a neighborhood’s boundaries. Click the + icon on the right side of the page.
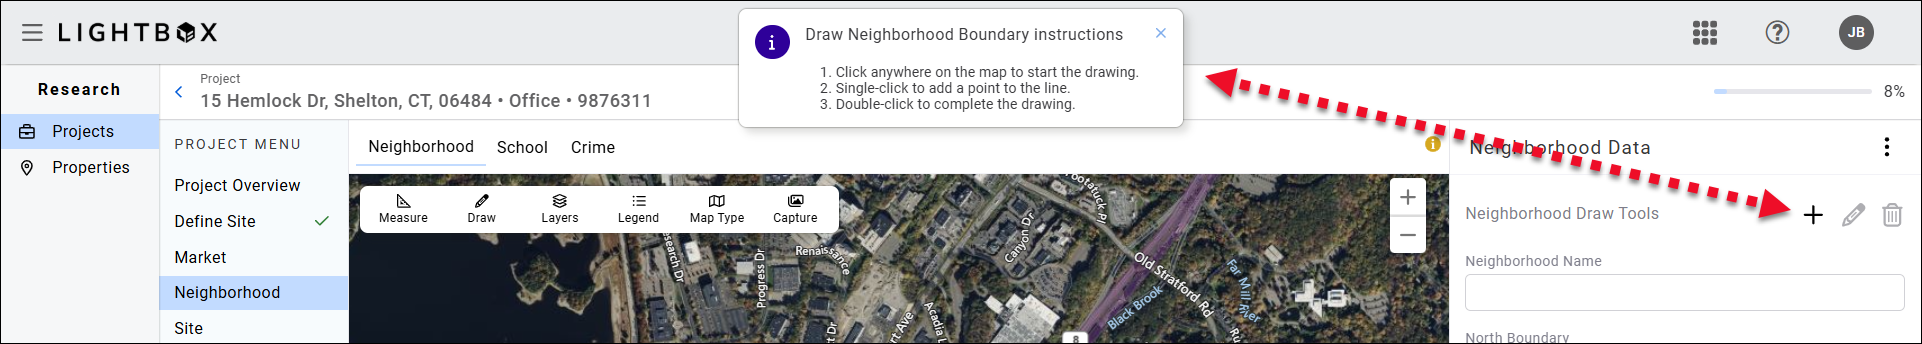 A popup will appear at the top of the page and provide the following instructions:
1. Click anywhere on the map to start the drawing.
2. Single-click to add a point to the line.
3. Double-click to complete the drawing.
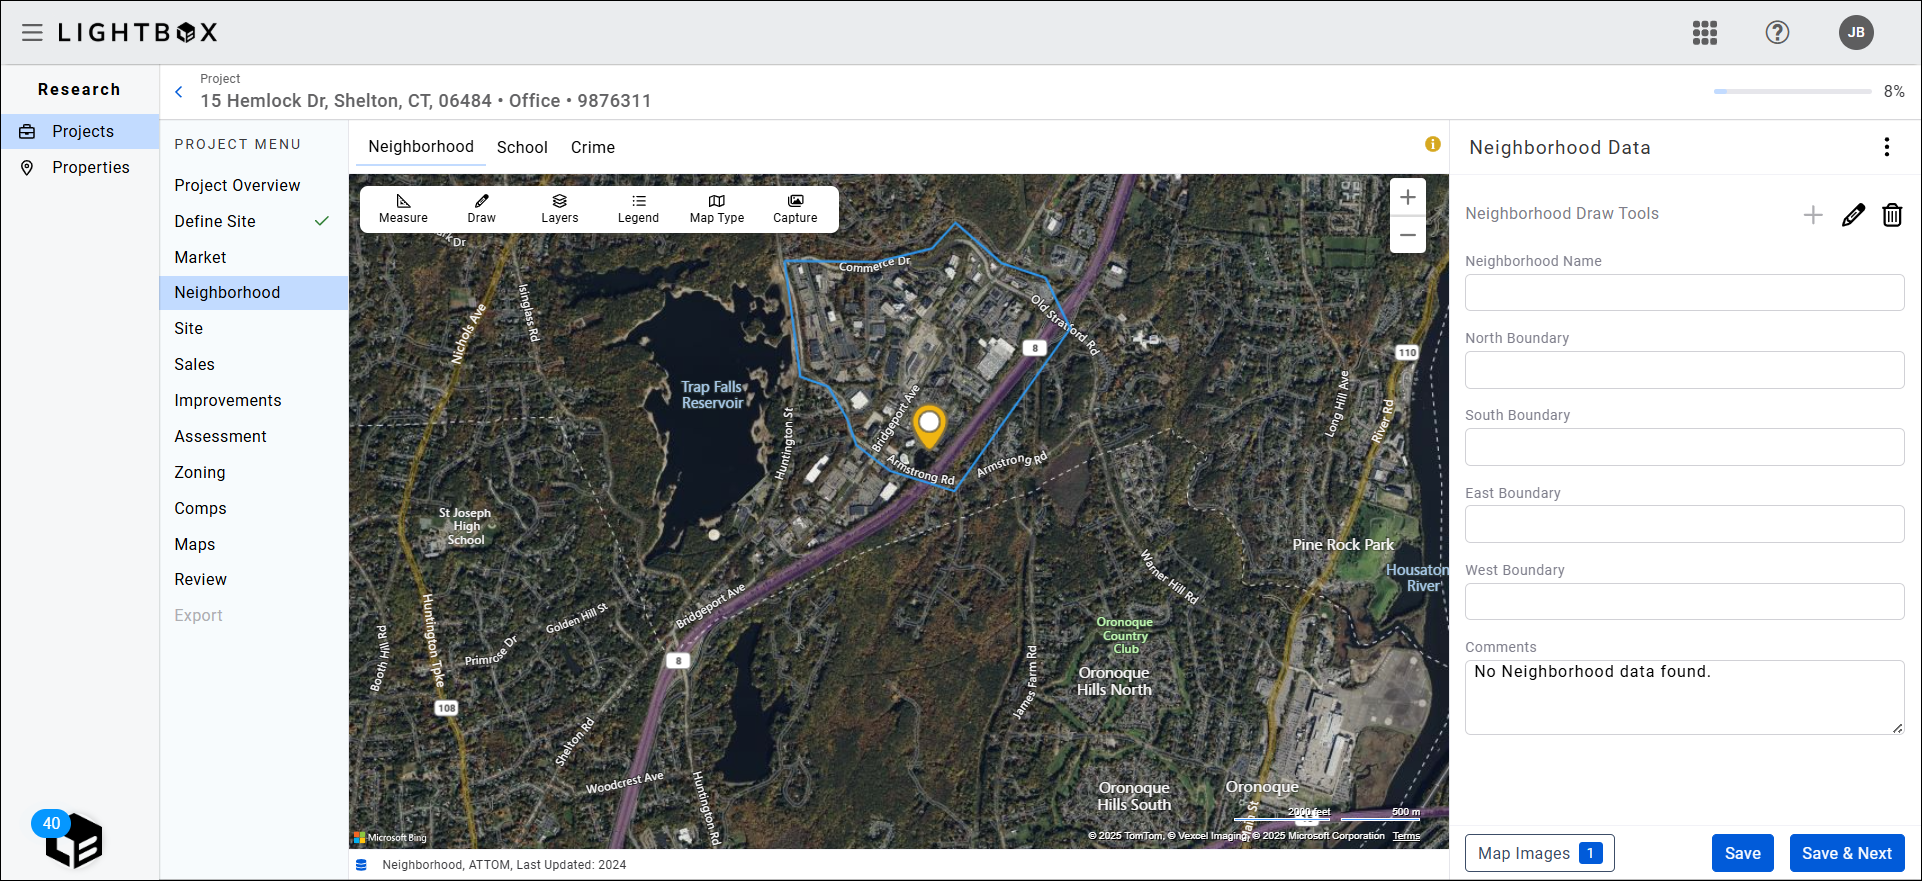
Once a neighborhood has been defined, click the pencil icon to edit it or the trash can icon to delete it.

A confirmation popup will appear and request confirmation to delete. Click Delete to delete the neighborhood drawing.
A Neighborhood Name, boundaries, and comments can be added in the panel on the right.
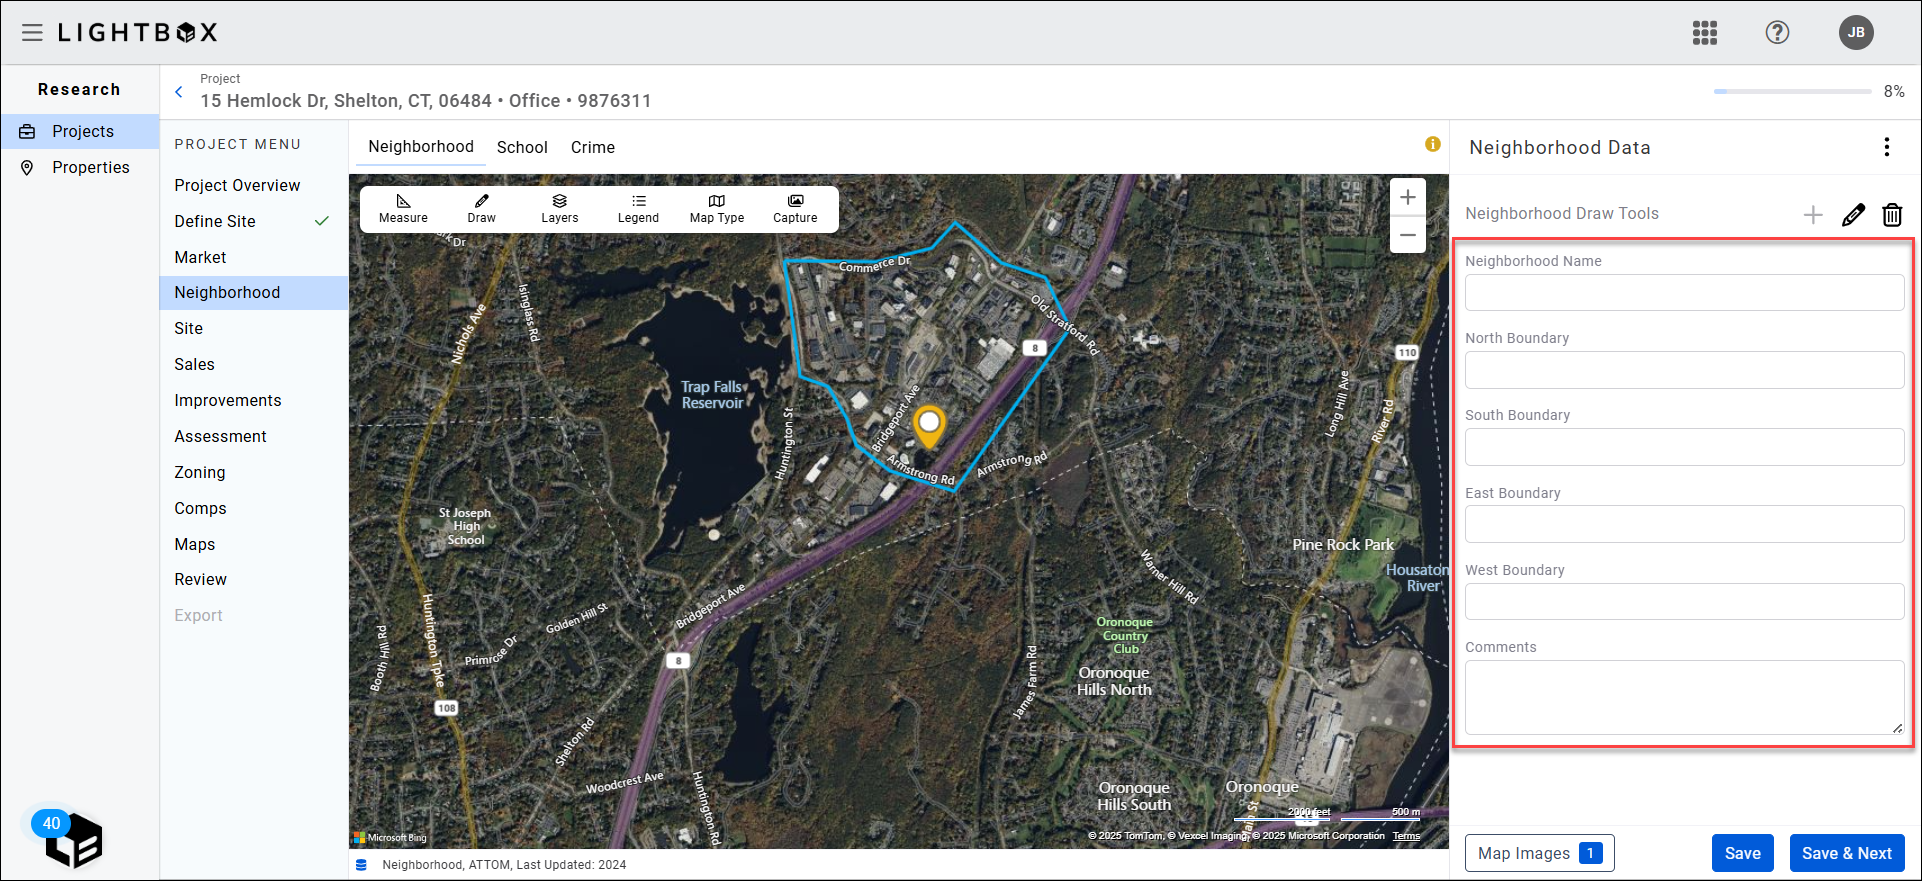
Click Save and Next to save the drawing and data entered and proceed to the School exhibit.
School
The data source for the School exhibit is Greatschools.com. Two layers can be turned on to display school names and school district names:
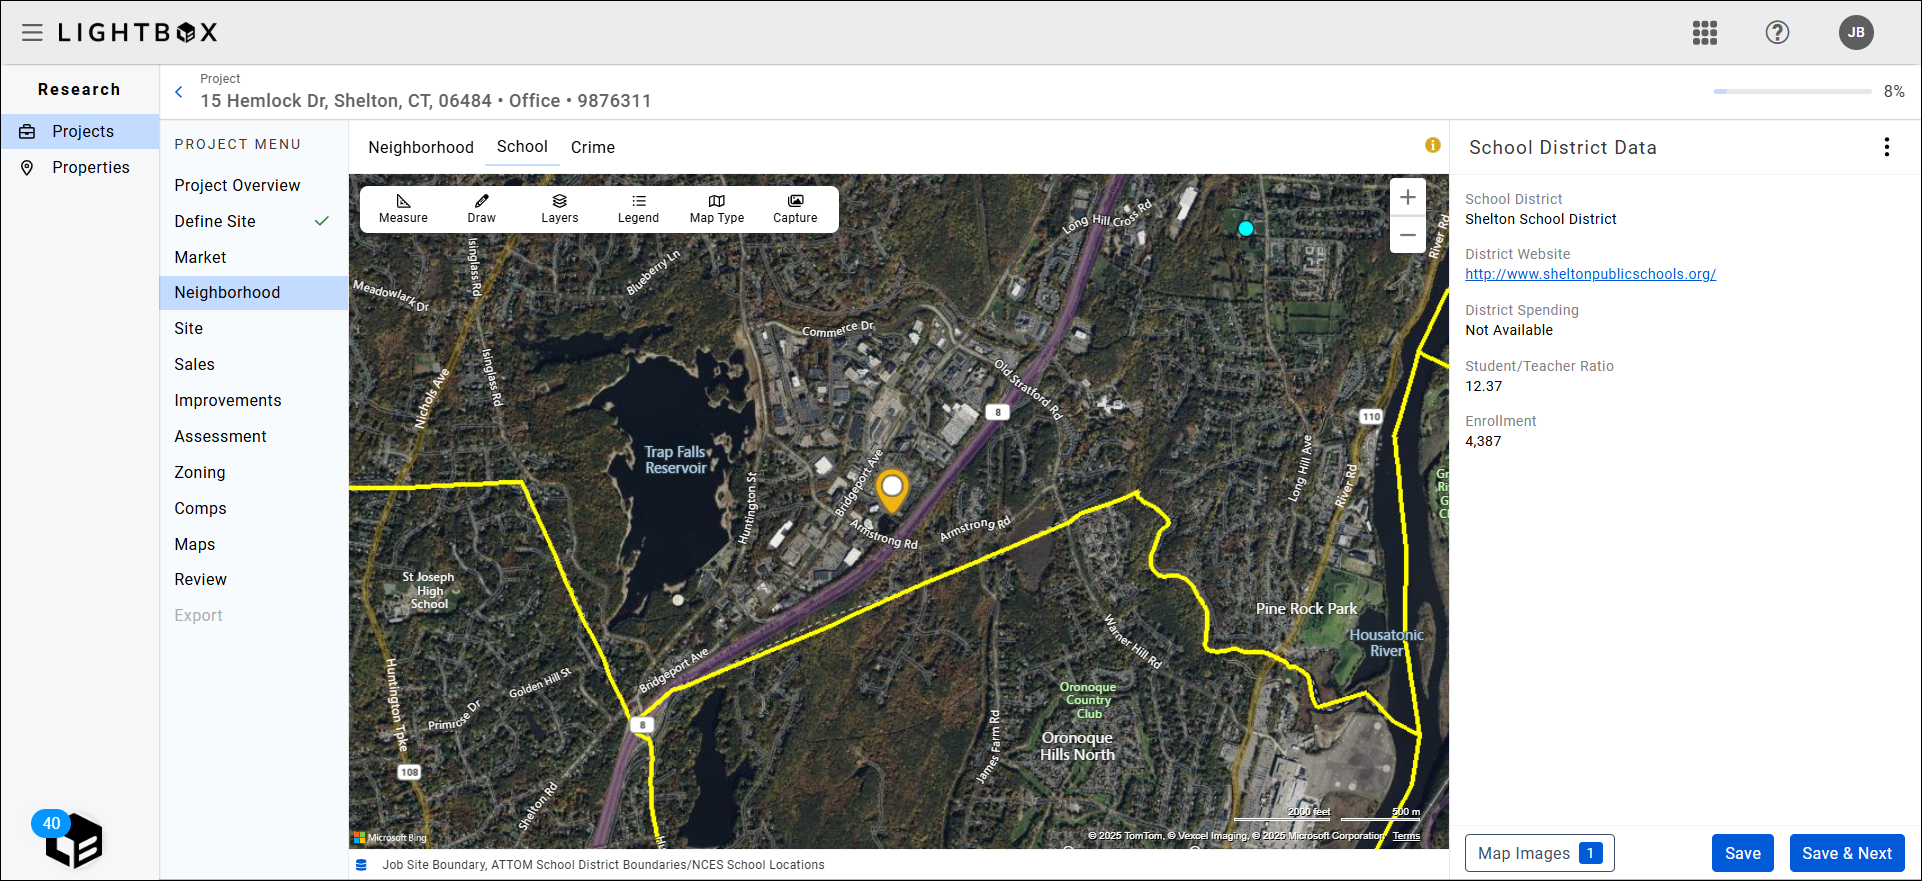
- Labels: Schools | School Districts
- Labels: Schools | Public Schools
Pin colors correspond to grade levels. Click the Legend button in the toolbar to display a legend.
Note:
The School exhibit is an excellent map for multi-family properties.
Crime
The Crime exhibit is a thematic map that can assist in deriving market sentiment. The data is provided by EASI.
.png)
Note: All values displayed are based on a relative index. They range from 0 (lowest level of crime) to 200 (highest level of crime).
Was this article helpful?