Market
- Print
- DarkLight
- PDF
Market
- Print
- DarkLight
- PDF
Article summary
Did you find this summary helpful?
Thank you for your feedback!
Overview
The Market section provides tools and data for understanding the market in which the subject property is located. The section contains two tabs: Boundaries and Demographics.
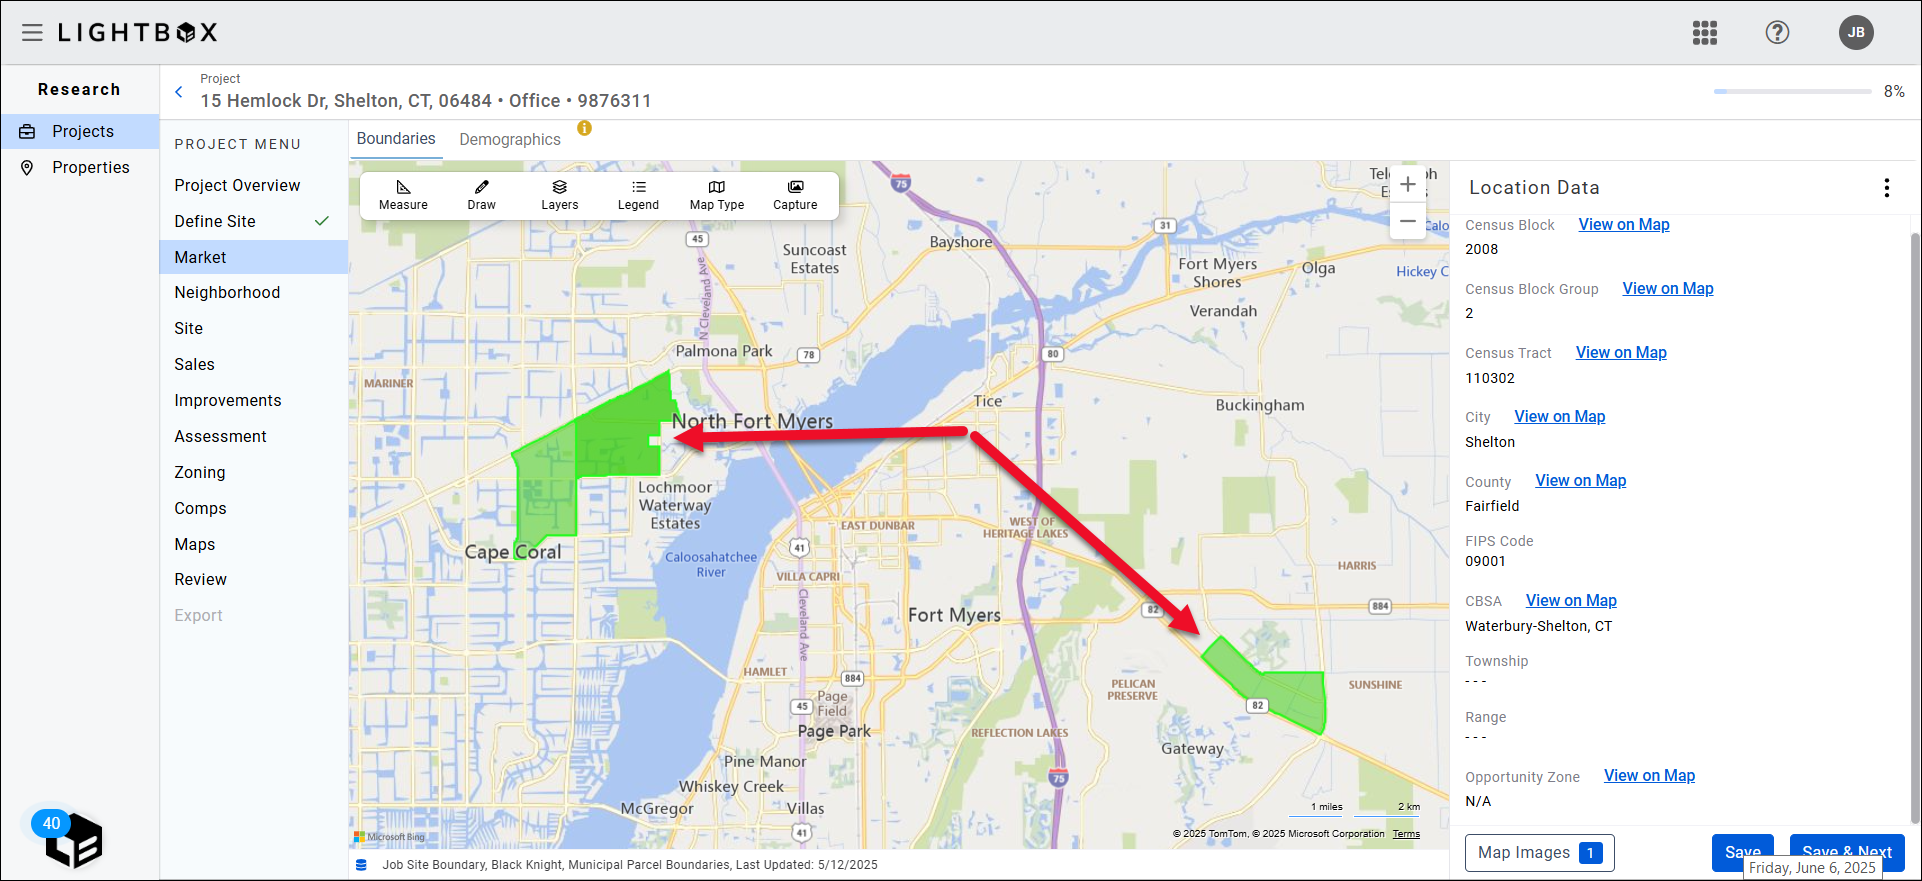
Boundaries
The Market Boundaries tab is useful for market or regional analysis. If available boundaries do not accurately represent the market, use the polygon drawing tool for a custom boundary.
Multiple layers are available and toggled on by default, including state, county, CBSA, and zip.
The Market Boundaries data is provided by the U.S. Census Bureau.
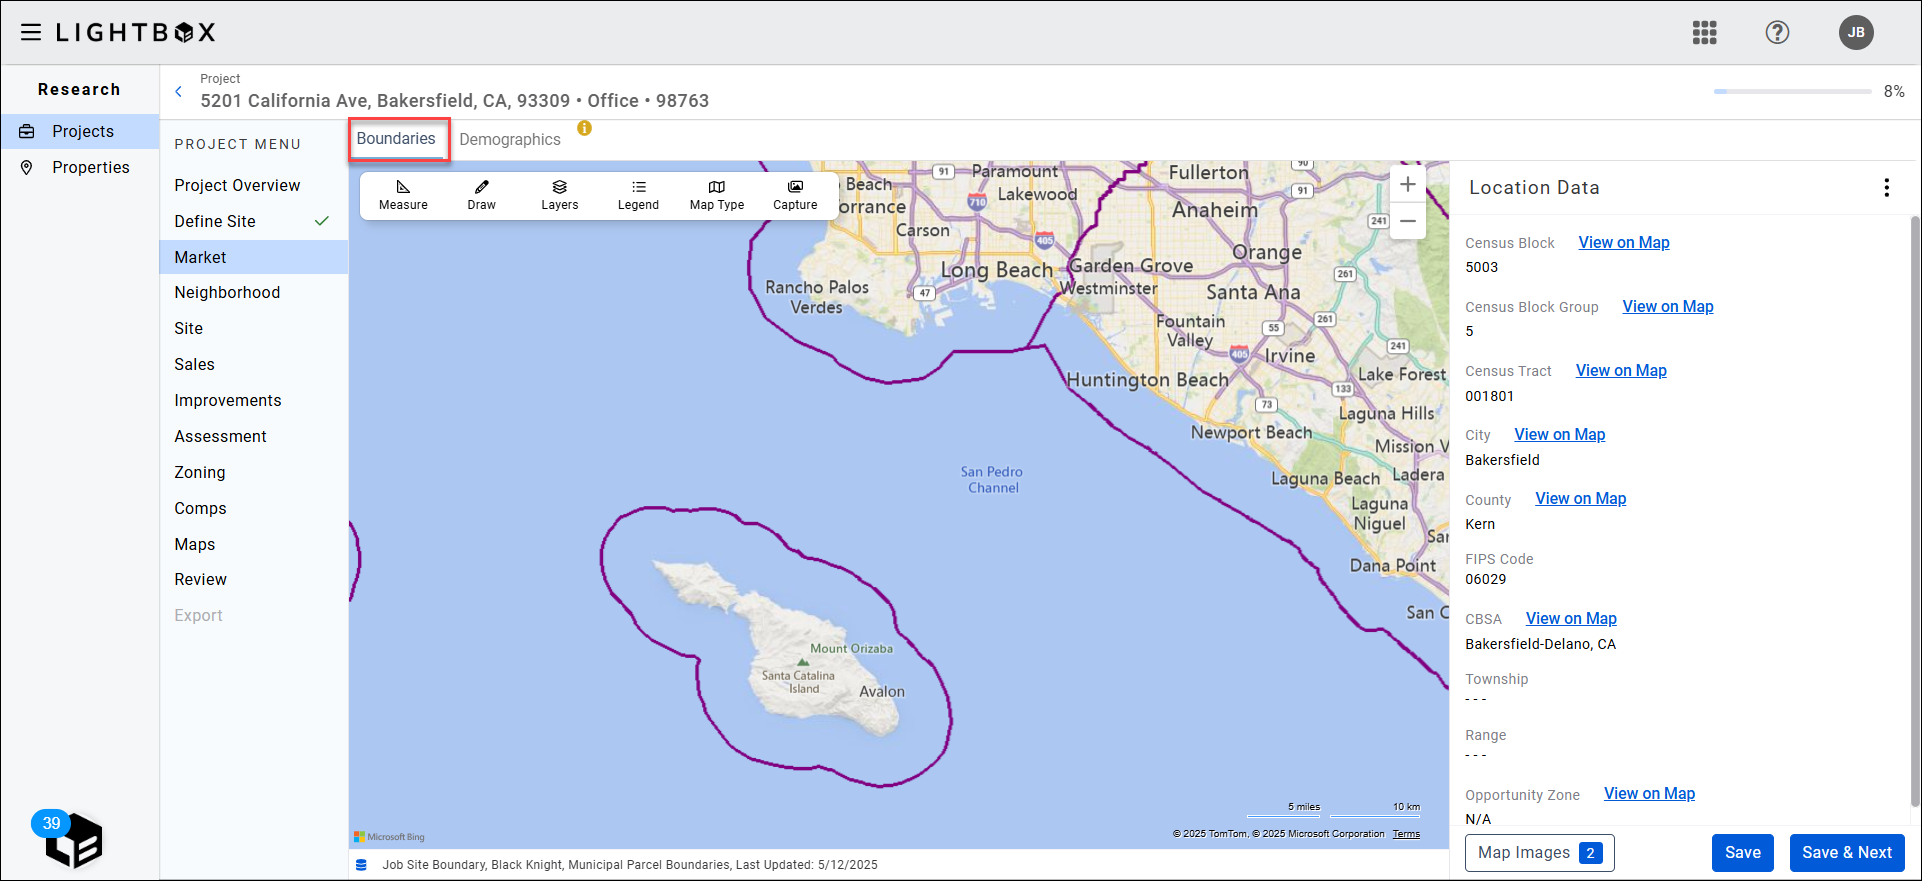
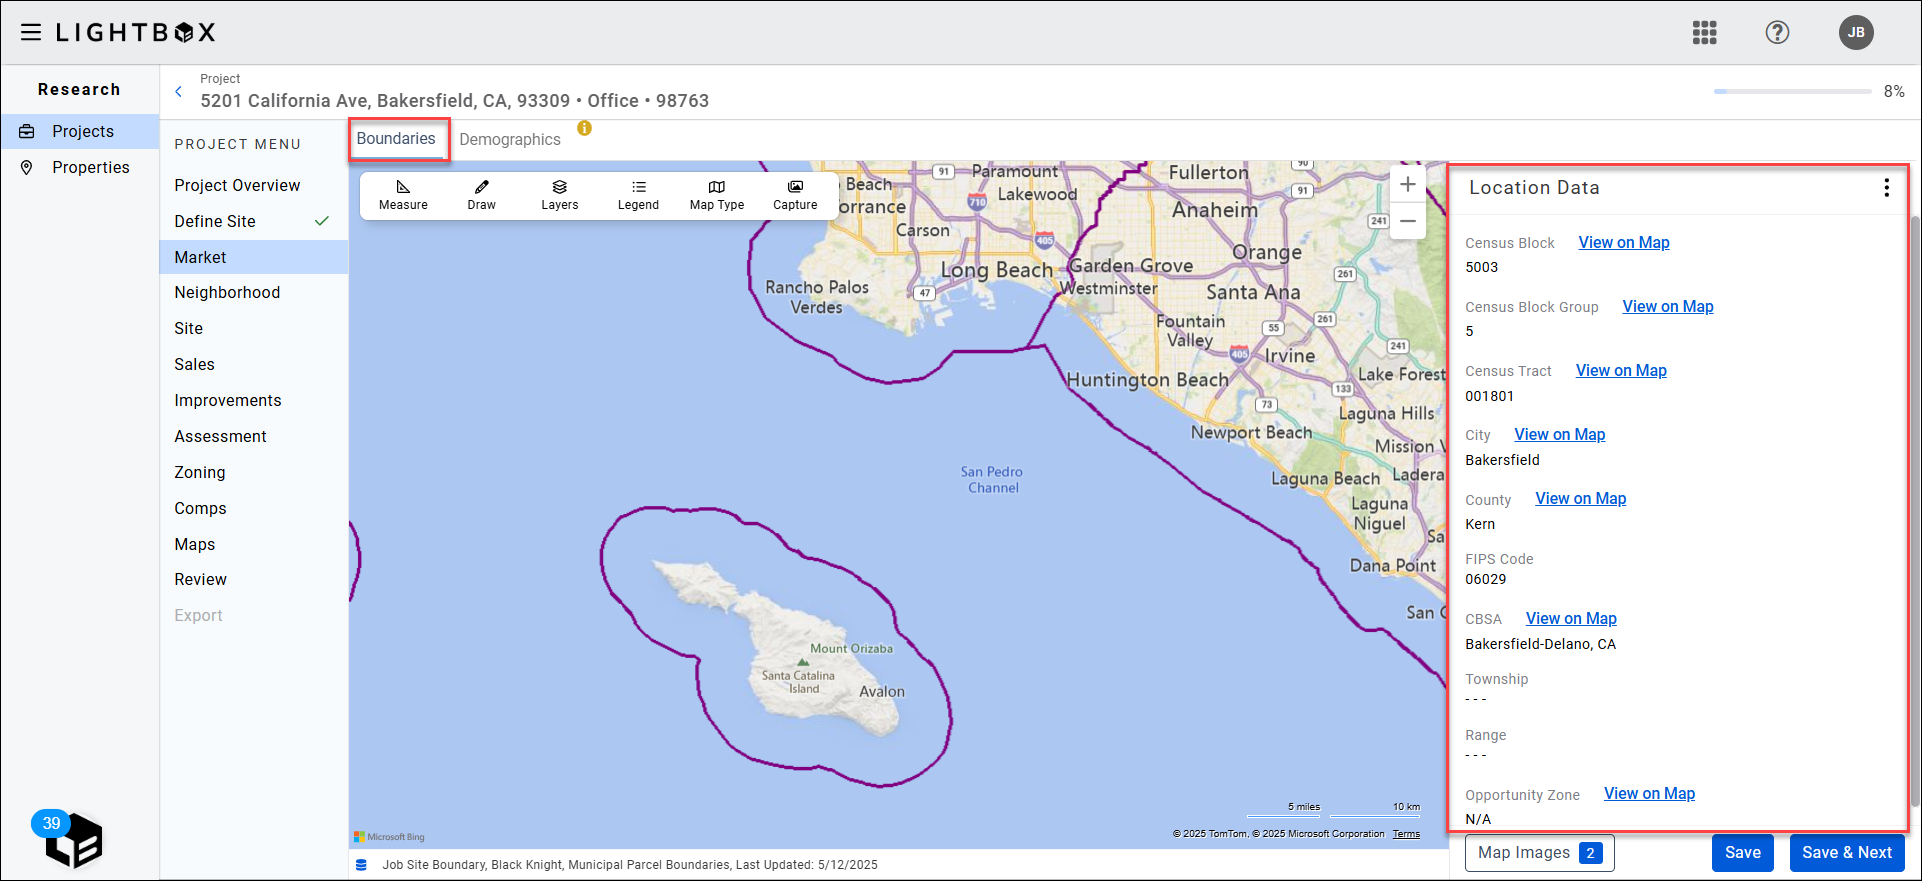
The data panel on the right includes links that show/hide the following location data on the map:
- Census Block
- Census Block Group
- Census Tract
- City
- County
- CBSA
- Opportunity Zone
Click a link to show/hide the corresponding location data on the map.
In the example below, the Opportunity Zone location data is displayed.
In the example below, the Opportunity Zone location data has been hidden.
The Boundaries tab includes the map tools below. Click Here for instructions about the tools.
- Measure
- Draw
- Layers
- Legend
- Map Type
Demographics
The Demographics tab allows the user to define trade areas around the site and access demographics information for a market analysis.
The Demographics page is divided into two sections: the map and Site Demographics.
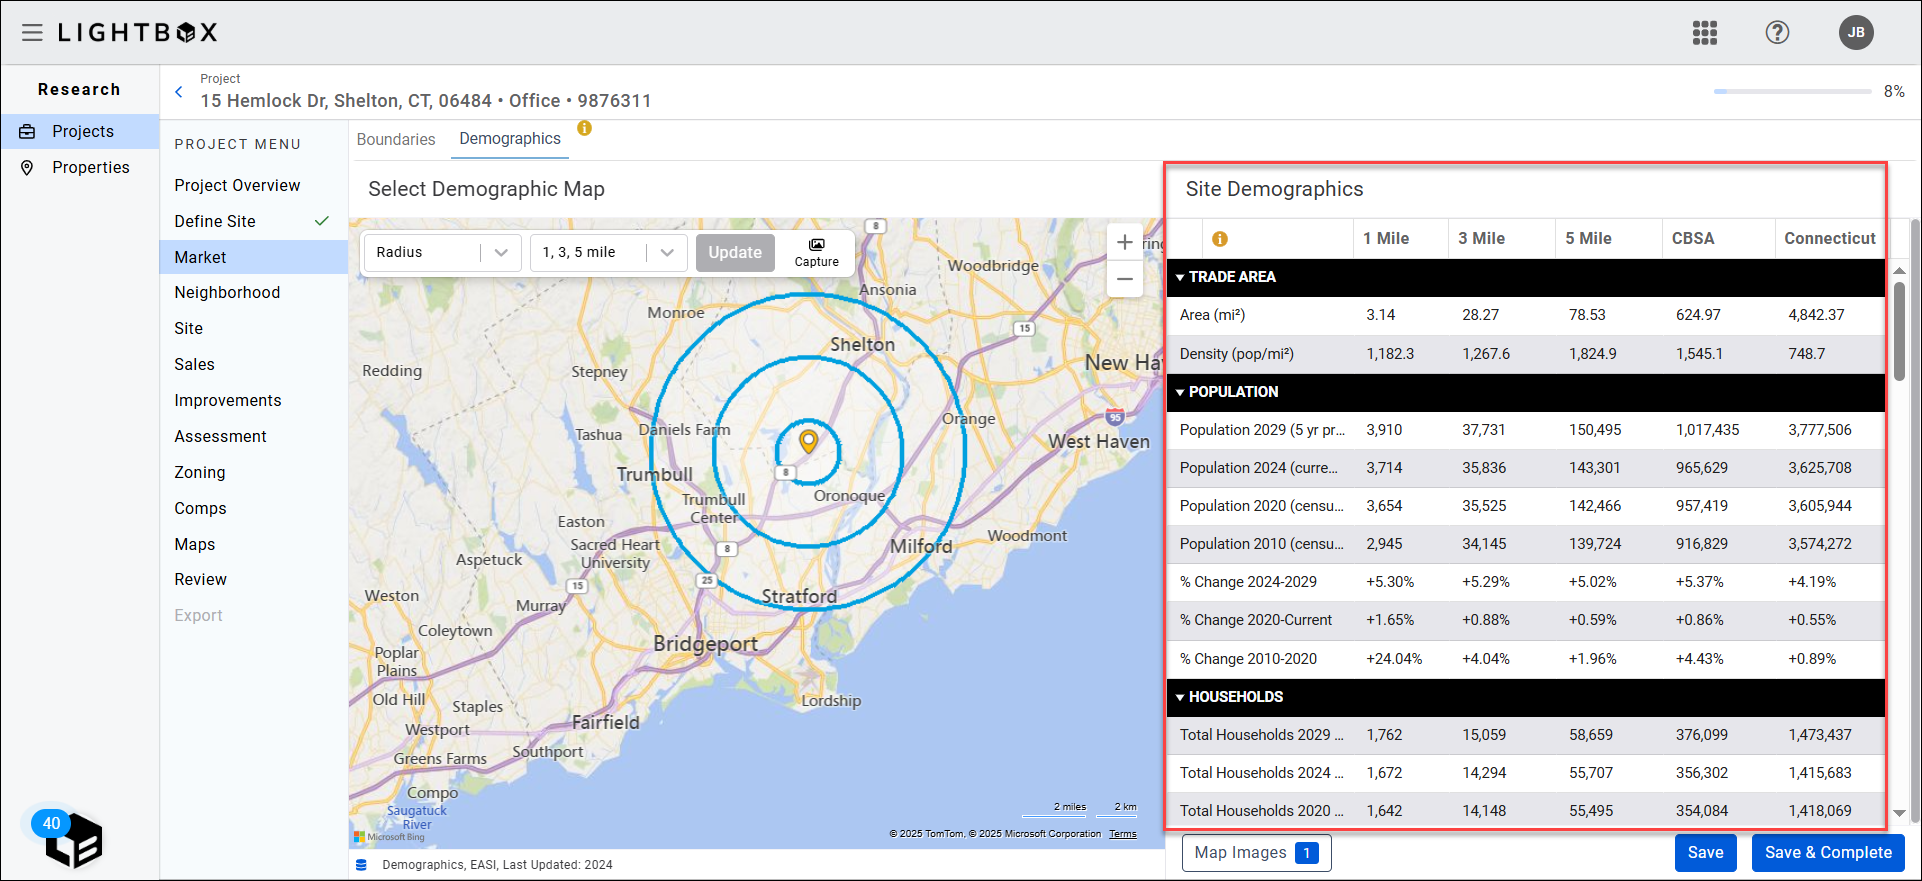
The Site Demographics panel on the right provides data about the map selection on the left.
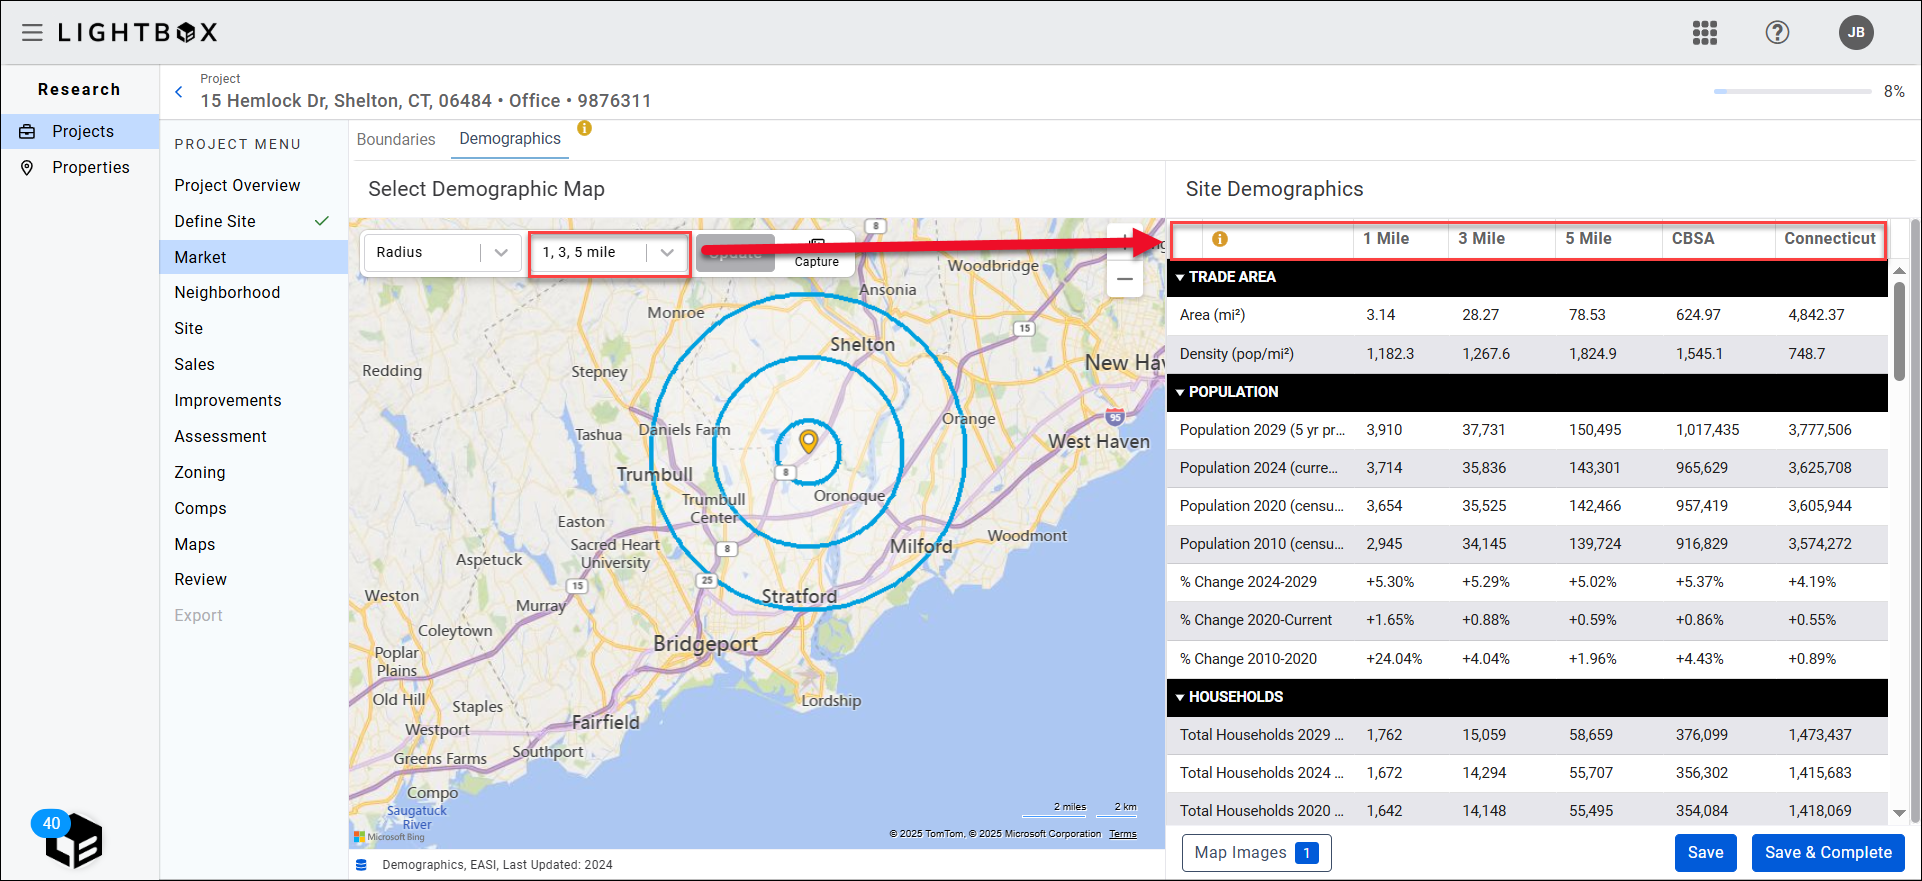
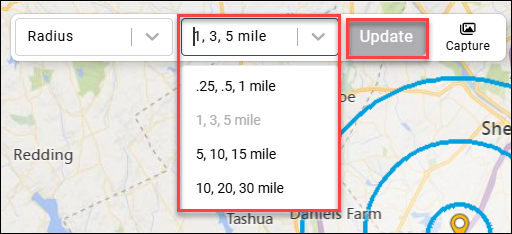
By default, the map will display radius data at default intervals of .25, .5, and 1 miles from the site. To change the intervals, click the drop-down menu, select from the available interval sets, then click Update. It may take a few moments for the map and Site Demographics panels to update.
The data in the Site Demographics panel will reflect the selections made on the map panel.
In the example above, Radius Map is selected with the default distance settings. The corresponding data is presented on the right, along with the CBSA and the entire state. County and US demographics will also be included in the export.
Click the drop-down menu on the left, select Drive Time, then click Update to switch from the Radius Map display to the Drive Time display.
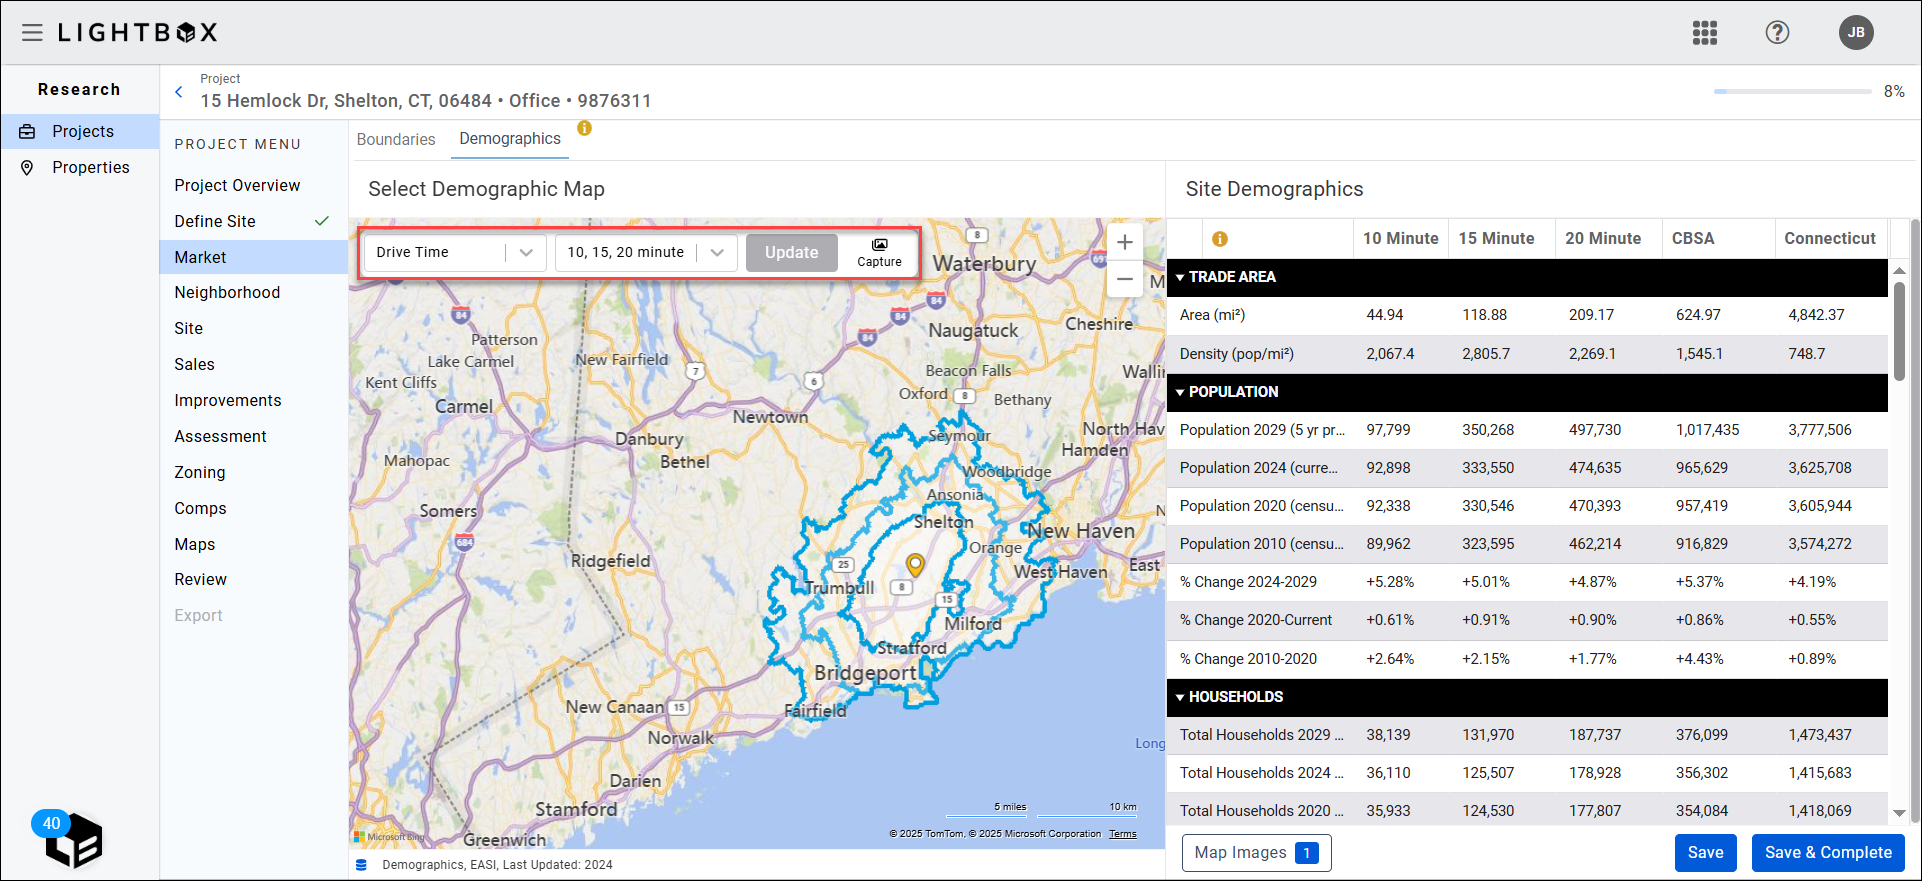
The default setting for Drive Time is 5, 10, 15 min. That can be increased to a set of 10, 15, 20 minute ranges or 15, 30, and 45 minute ranges. When the range is changed it will take a few moments for the map and Site Demographics panes to update with the new values.
NOTE:
Unlike the Radius Map, the Drive Time map will stop at bodies of water.
You can save one or more maps, and the corresponding Site Demographics data, to include in your project.
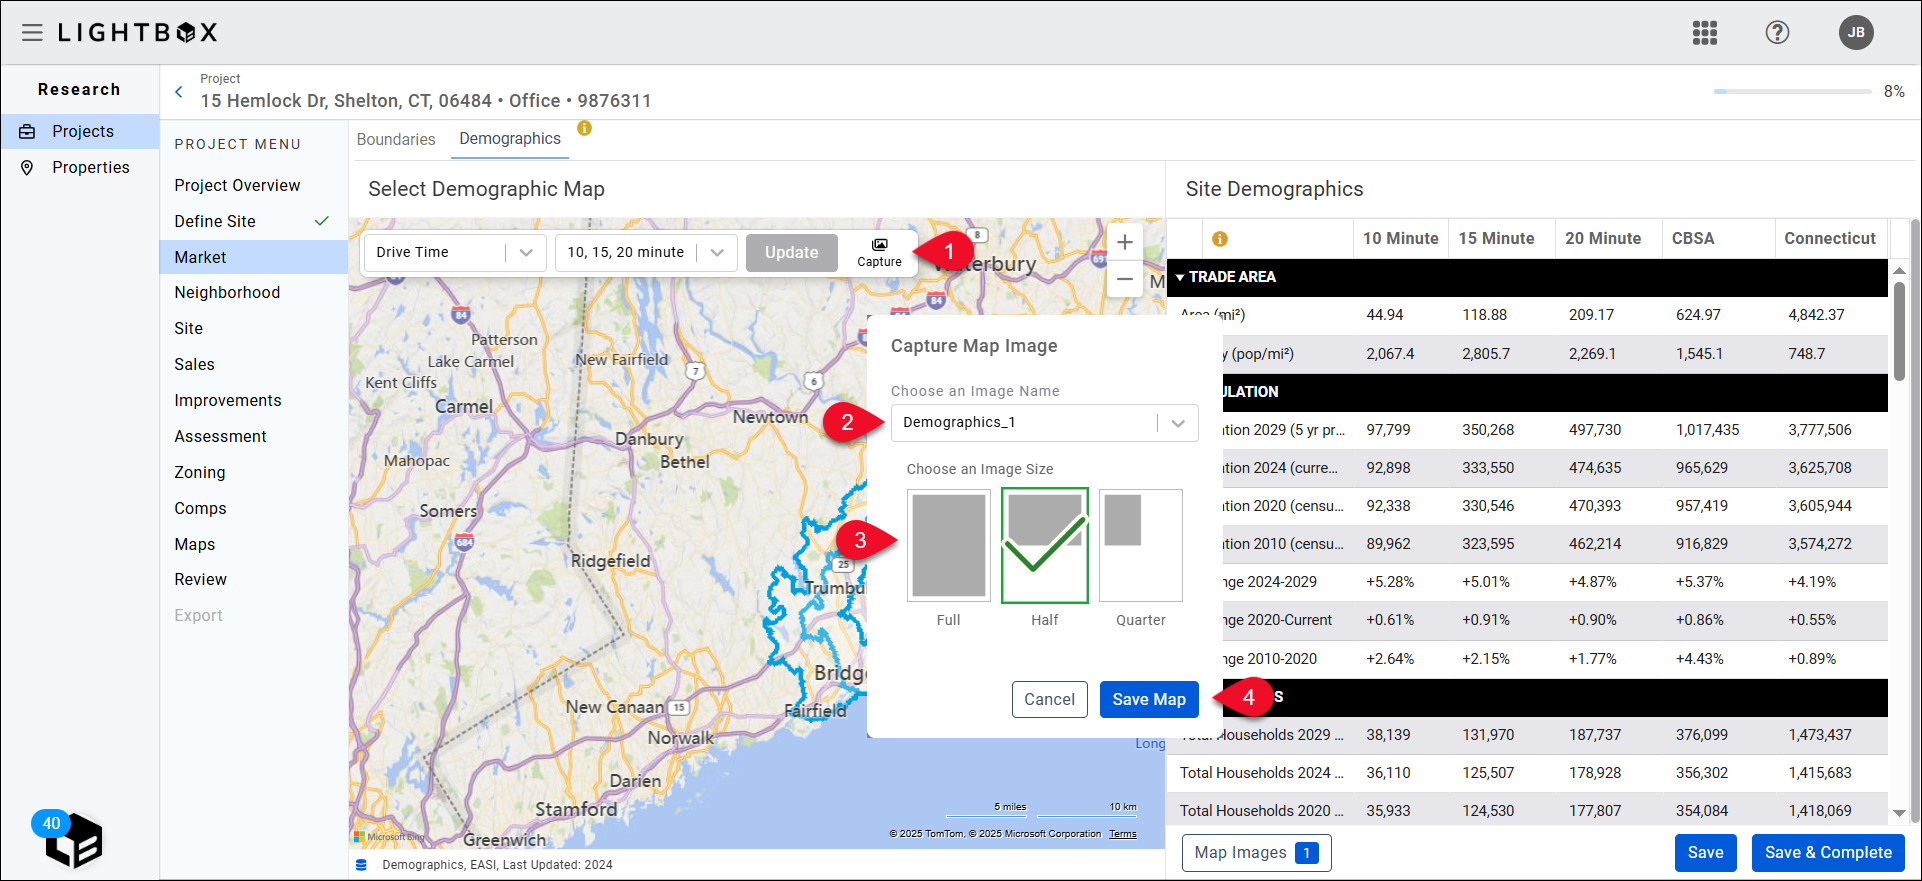
Click Capture.
Click the drop-down and select one of three available file names. If you have already saved an image with the selected file name a popup will warn you that using that file name will replace the existing map image.
Select an image size: Full, Half, or Quarter.
Click Save Map to complete the process.
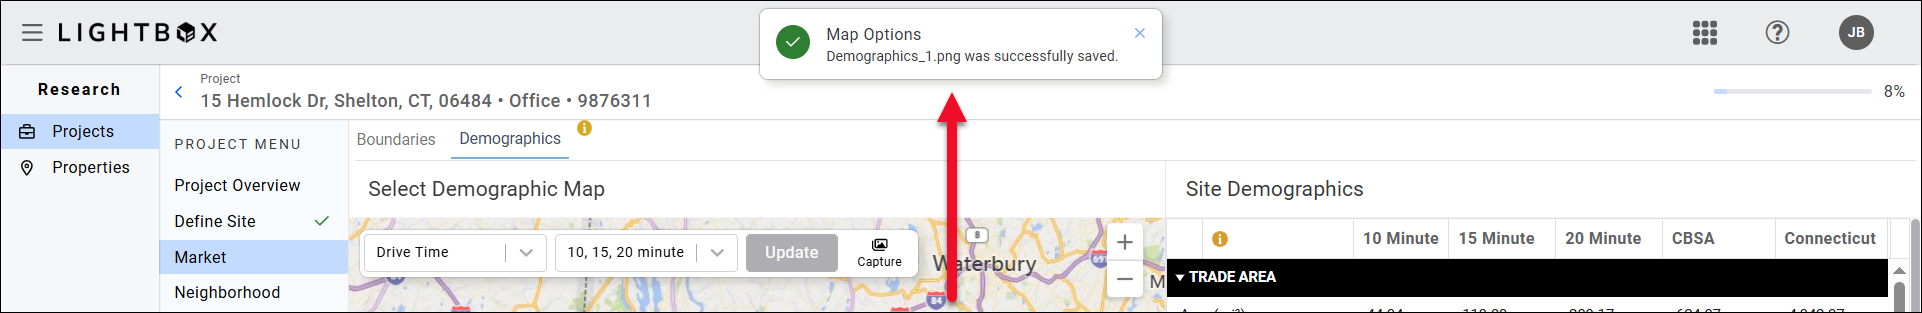
To save the map and data, click Capture. A confirmation message will appear at the top of the page when the image has been successfully saved.
To manage saved images, click Map Images at the bottom of the page. A modal will appear, displaying any images you have captured, along with a default image automatically captured by LightBox Valuation.
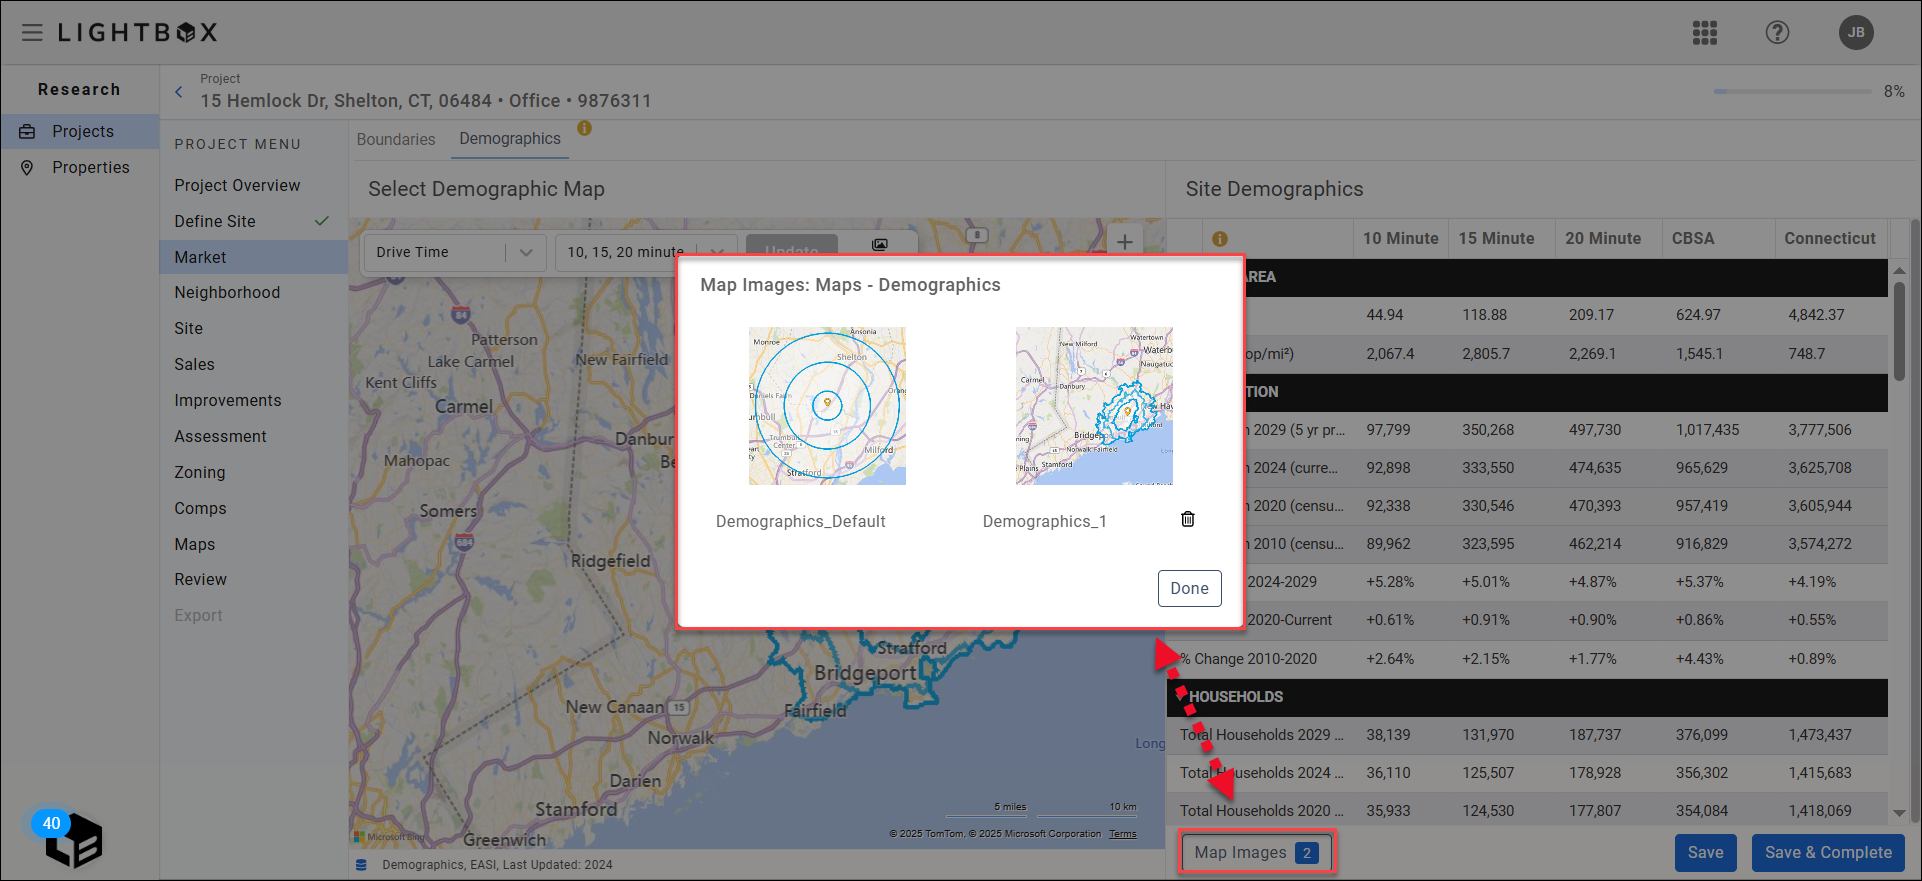
Click an image to see it full size. Click the trash can icon next to an image to delete it. Note that there is no warning or request for confirmation.
Note:
The default image cannot be deleted.
Click Done to close the modal.
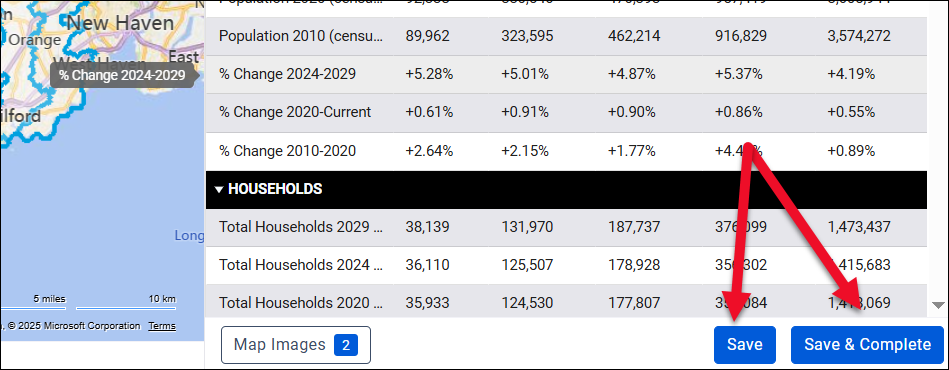
To save the work you have done in the Demographics section and return to it later, click Save in the bottom right corner of the page. To save your work and move on to the next section in the Research app, click Save & Complete.
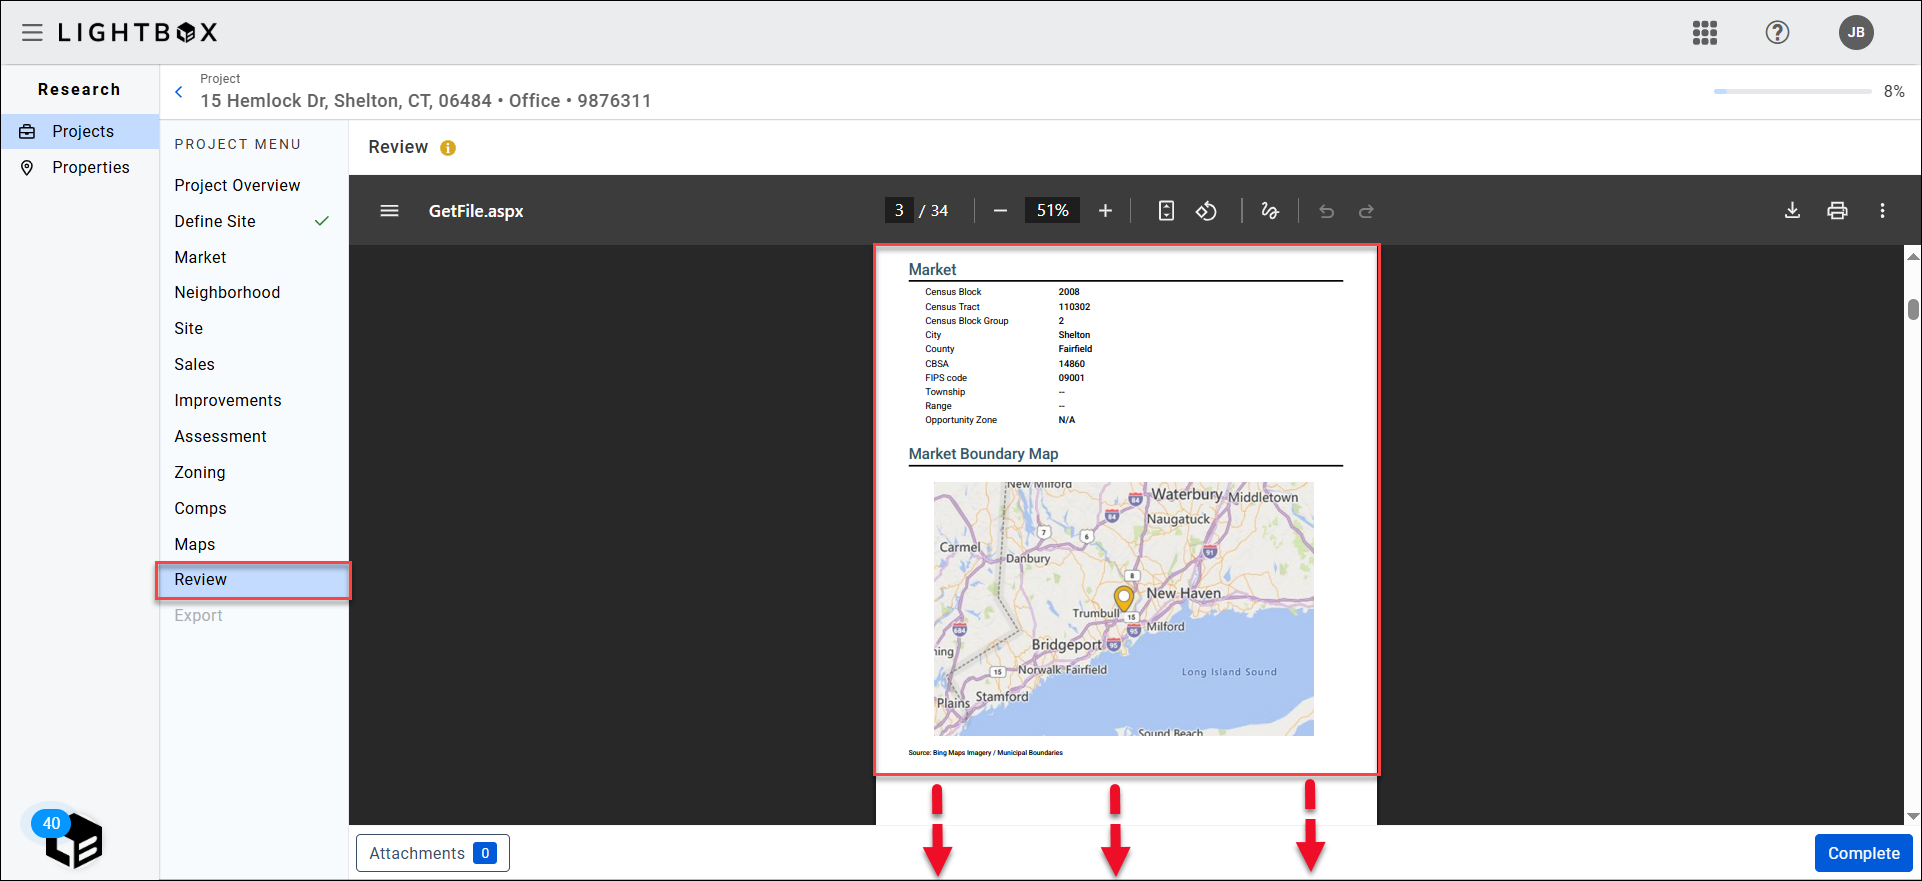
Review and Export
The Review section includes a section for Demographics. This section lists the default maps, any maps you captured, and the corresponding Site Demographics. Scroll down to see all of the information and images.
The Demographics data can be viewed and exported in the Export section of the Research app.
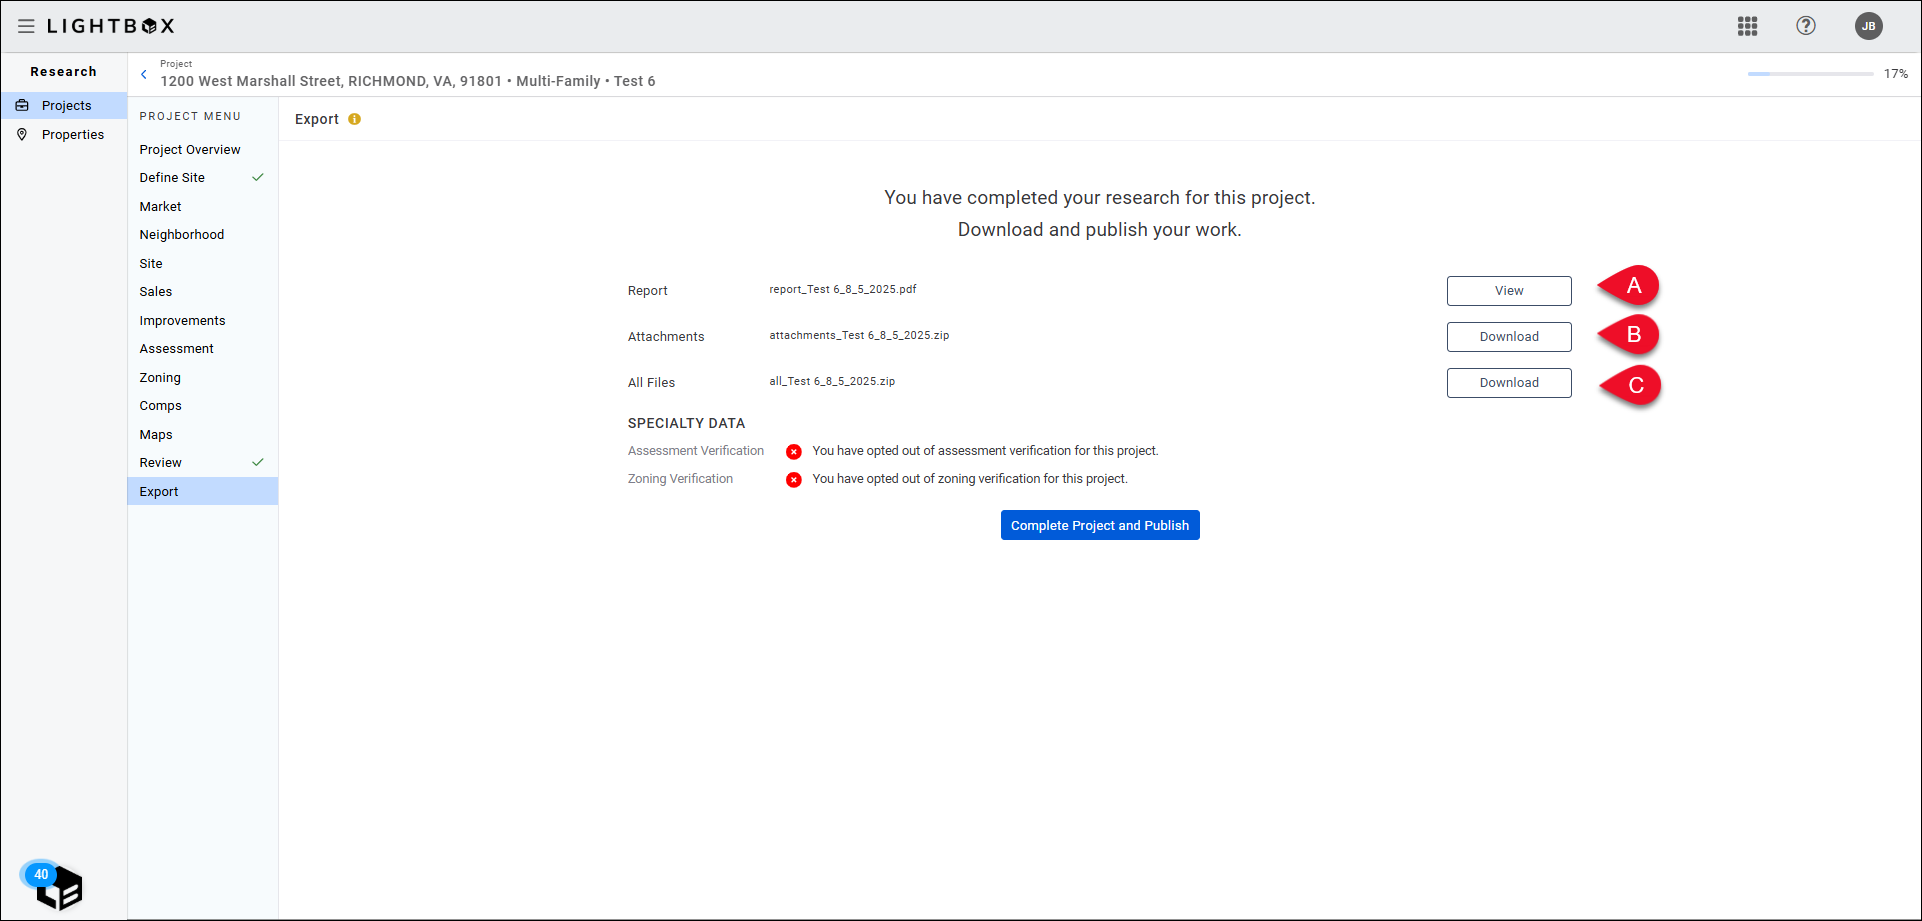
A. Report: Click to open a new browser tab that lists the Project data and images, including the Demographics section data and images(s).
B. Attachments: Click to open a new browser tab that lists the Project data and images, including the Demographics section data and images(s).
C. All Files: Click to download a zip file containing the entire Research project. This includes any images captured in the Demographics section, as well as a .csv file labeled “demographics.” This file contains the Site Demographics data.
Refer here for information about using the Demographics information in the Report Writer tool.
Was this article helpful?