- Print
- DarkLight
- PDF
Demographics
- Print
- DarkLight
- PDF
The Demographics display table allows importing demographics data from the Valuation - Research application.
1. Verify that the County and CBSA name are filled out in the File Info worksheet.
2. Navigate to the Demographics table in the Valuation Model.
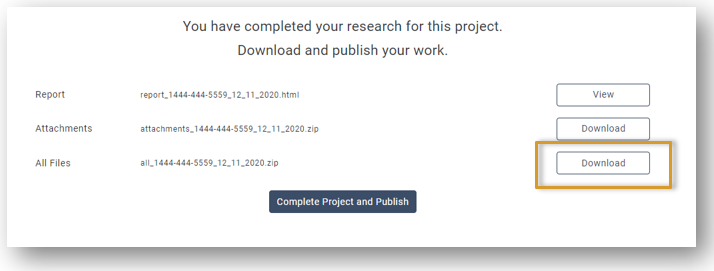
3. Extract the All Files attachment from the Research Project download associated with the subject.

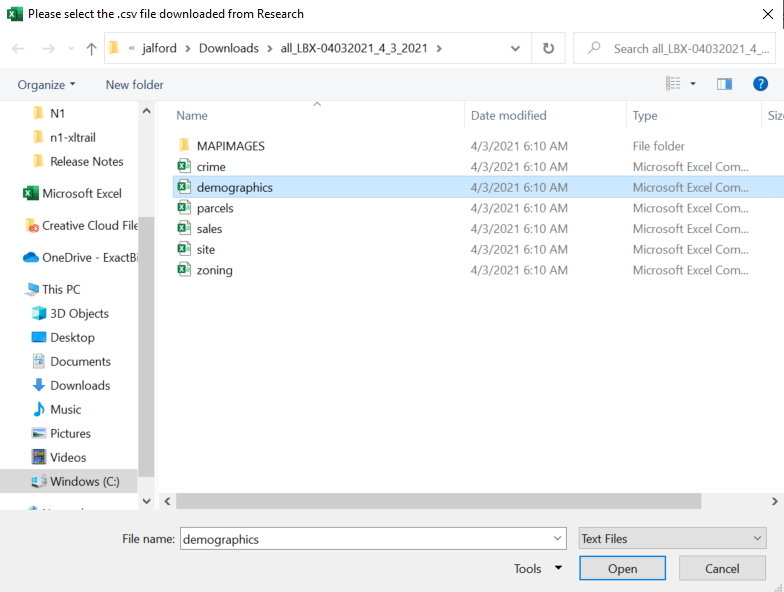
4. Click the Import Demographics from .csv button and browse to the saved Demographics.csv file and click the Open button.

5. Select the analysis area that most closely resembles the subject's neighborhood.

6. Select the trade areas you would like to display. For legible results, we suggest no more than 5 trade areas. Click the Toggle Display button.

7. If a demographics update has occurred, update the current and projected year.

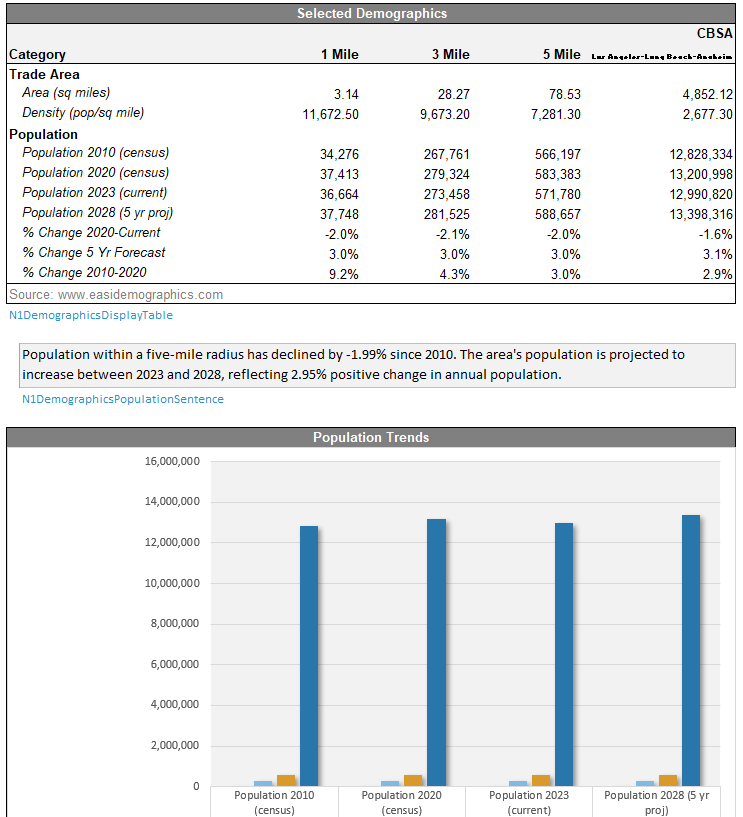
8. The demographics data will automatically displayed in tables and charts and automated analysis sentences will formulate.

9. A summary table with derived key data points will be populated based on the chosen analysis area. Employment and Overall Outlook are dropdown options based on the appraiser's analyis.
.png)

.png)