- Print
- DarkLight
- PDF
Comparable Summary Table
- Print
- DarkLight
- PDF
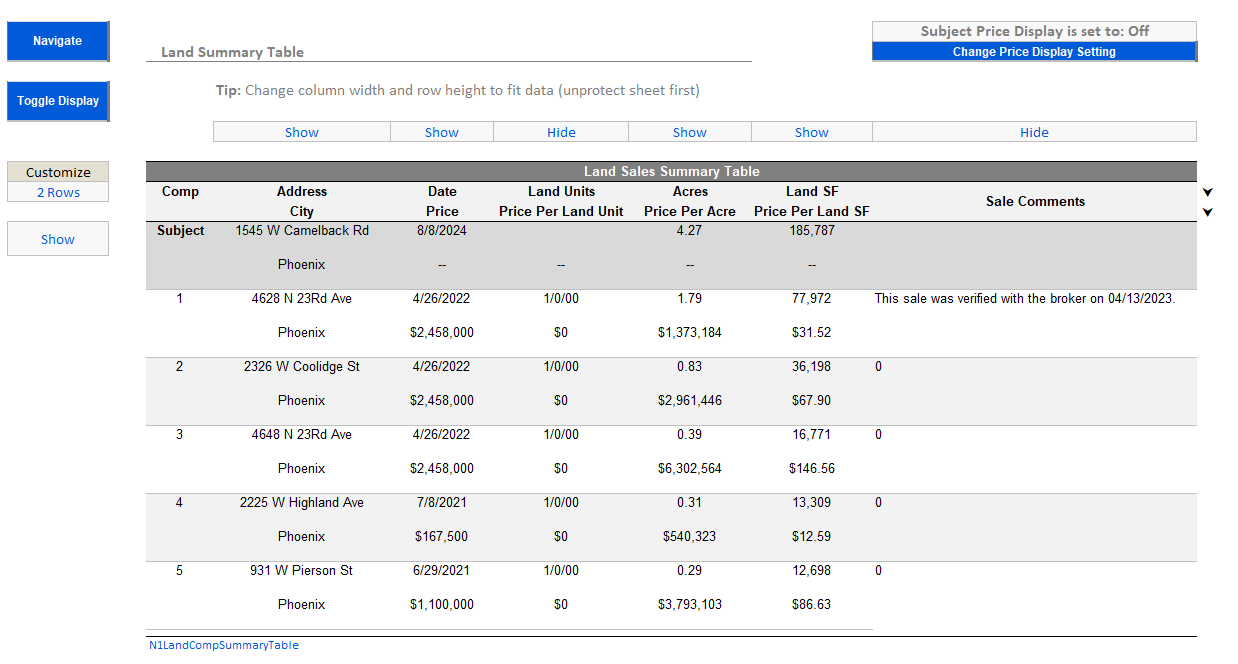
The summary table will automatically display the comparables selected for analysis. The summary table has up to 15 columns that can be displayed by clicking Toggle Display. Each column displays the data selected in the column headers.
The table can be formatted to display one or two rows of data for each property. Optionally, subject data can also be displayed by clicking Toggle Display and selecting Show for the subject row.

The Subject Price Display can be toggled between On and Off, with each respective option affecting the display of the subject value fields in the table.
There is also a set of rows at the bottom of the table that display the MIN, MAX, Average and Median of the fields above. Use the Show/Hide dropdowns to format the table.

.png)

.png)