- Print
- DarkLight
- PDF
Selecting the Data
- Print
- DarkLight
- PDF
Click on the Select Data button.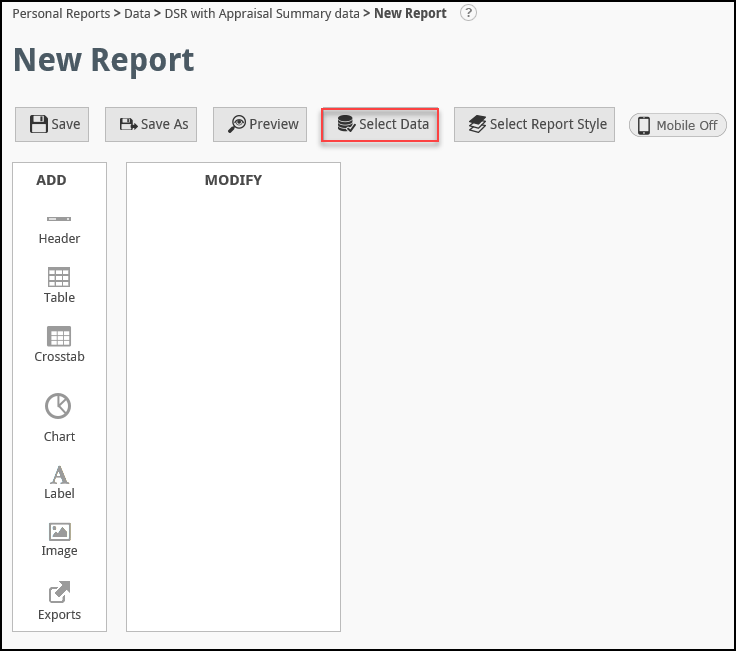
The Select Data screen will open.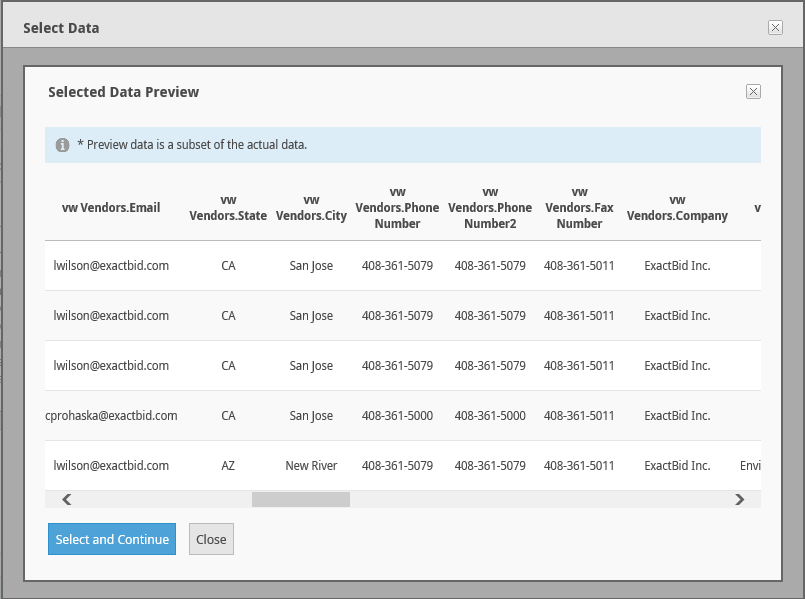
This screen allows the user to select all the data fields that will be included in the Report. The Reports data has three important features:
- The data is structured hierarchically: When the Select Data screen is first opened, the top-level views are displayed. Nested under each view (vw) are one or more fields. Clicking on the plus symbol (+) will display those fields.
- The data is relational: The data is interconnected. Each data field, such as Vendors State or Vendor Status, can appear in more than one table.
- The organization of the data largely mirrors RIMS processes: Data is grouped by the process or set of processes under which it falls. For example, fields related to the RFP process, such as Bids, Awards, and Vendor status can be found in RFP Details. Another example is fields like loan type, property contact, and cross collateral, which can be found Service Request Details for Project.
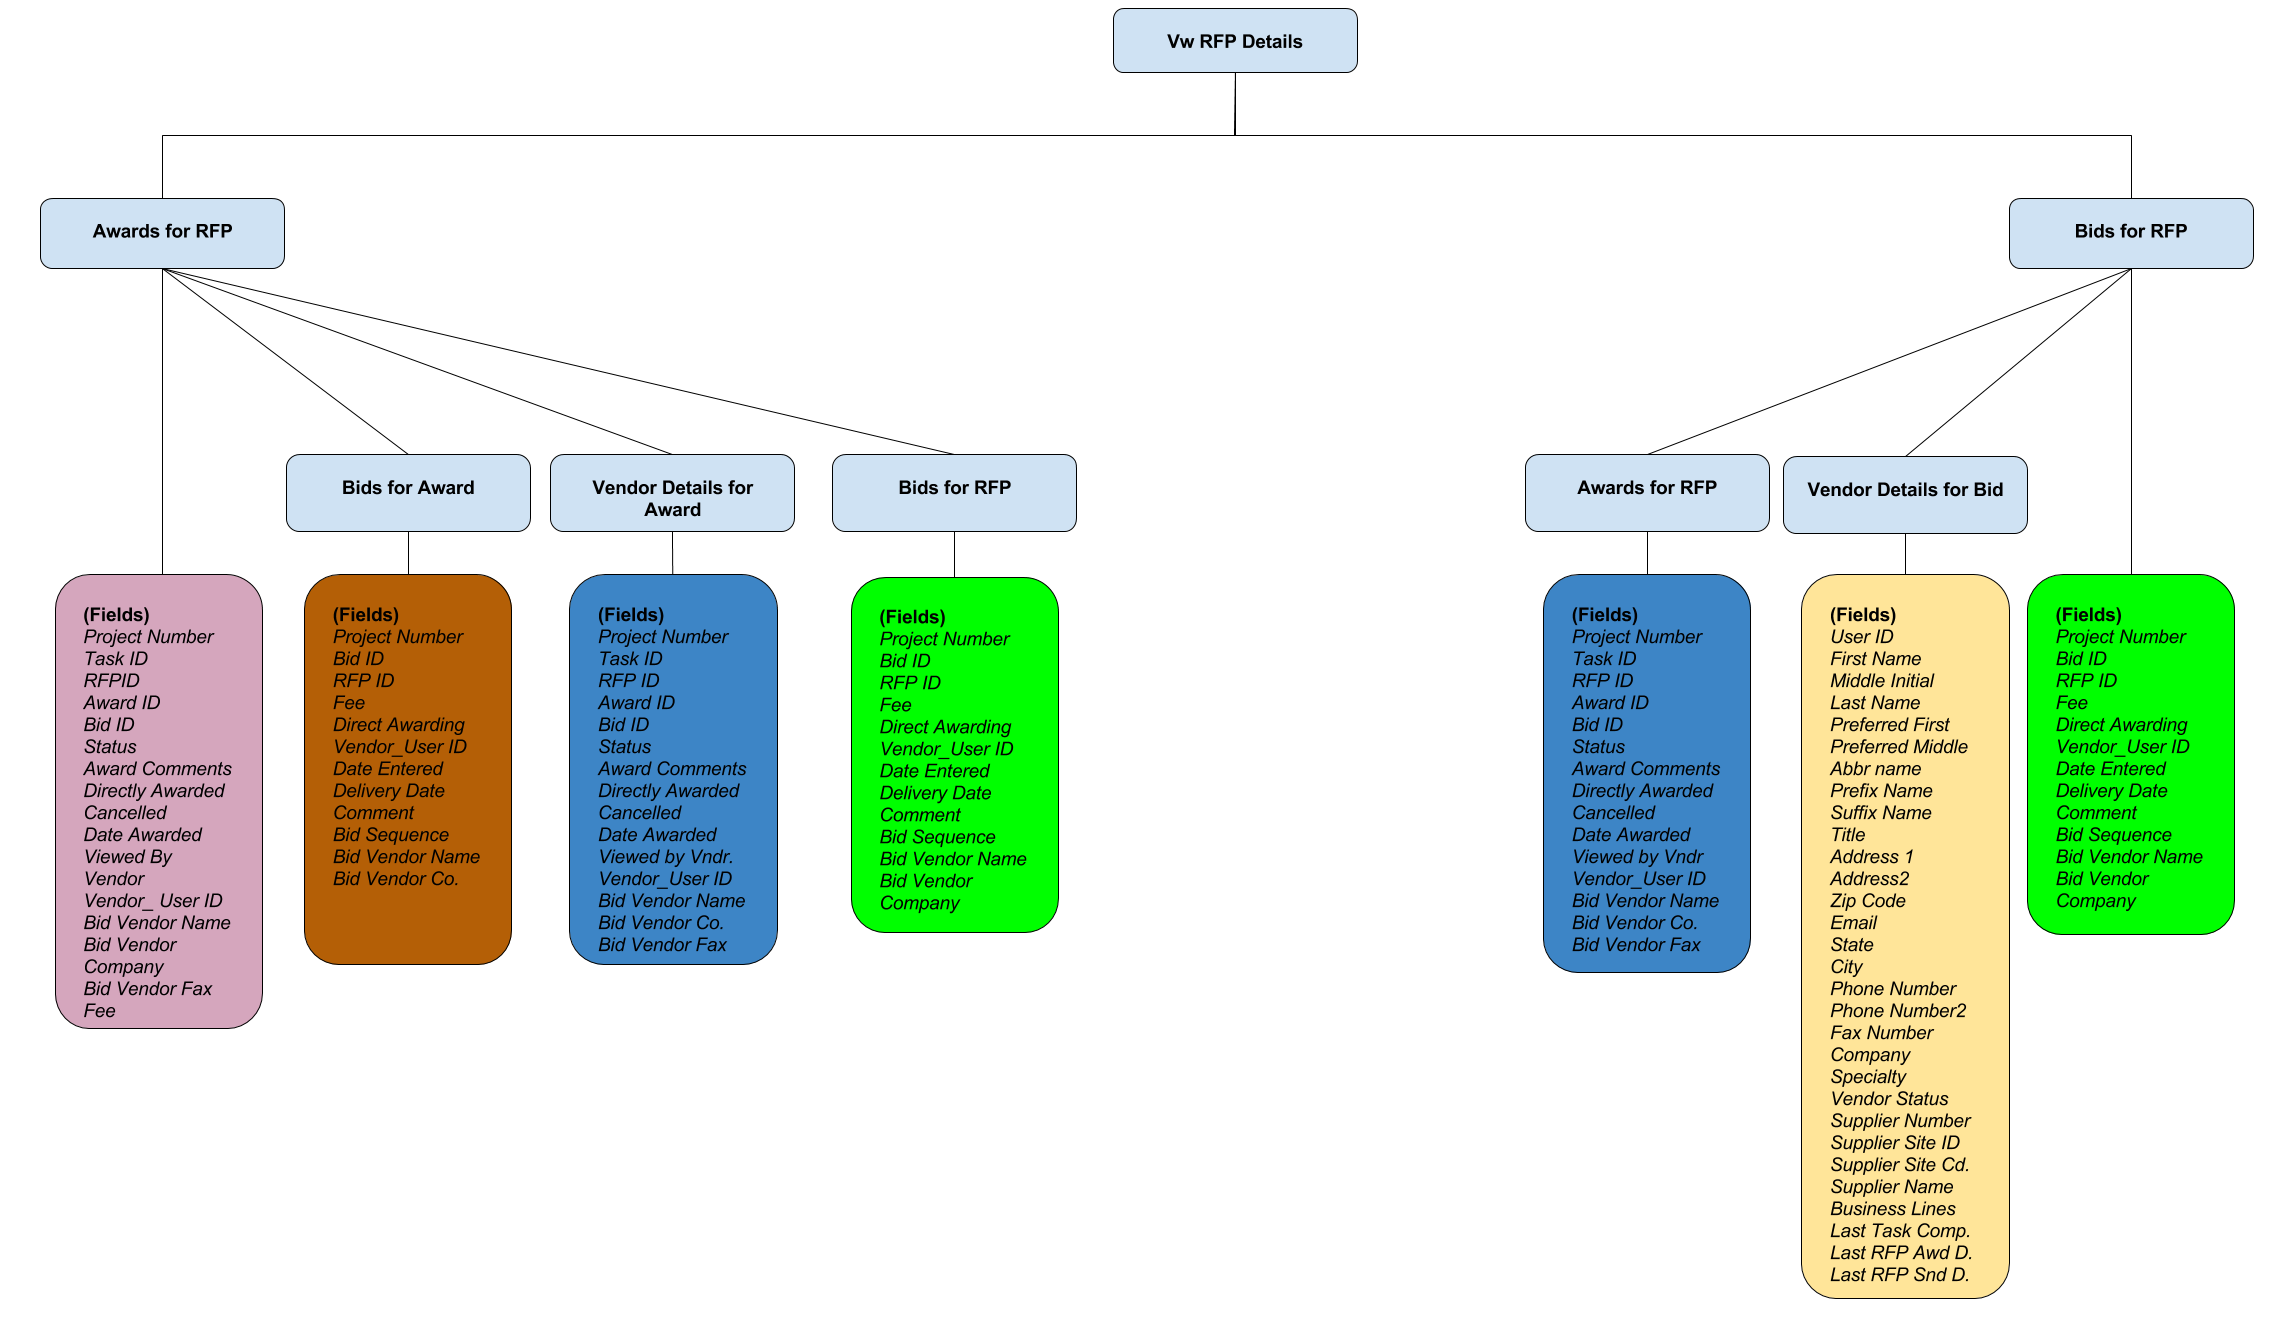
The chart below highlights the three qualities of Ad Hoc Reports data:
- Hierarchy: In the example below, vw RFP Details is the parent, with Bids for RFP and Awards for RFP nested underneath.
- Relational: Fields are found in more than one table. The Project Number field, for example, is found in multiple tables. Note that several tables contain all or almost all the same fields (these have the same background color).
- RIMS Organization: Fields are grouped by the related RIMS process(es).
 To view data in more detail, click the checkbox next to an item.
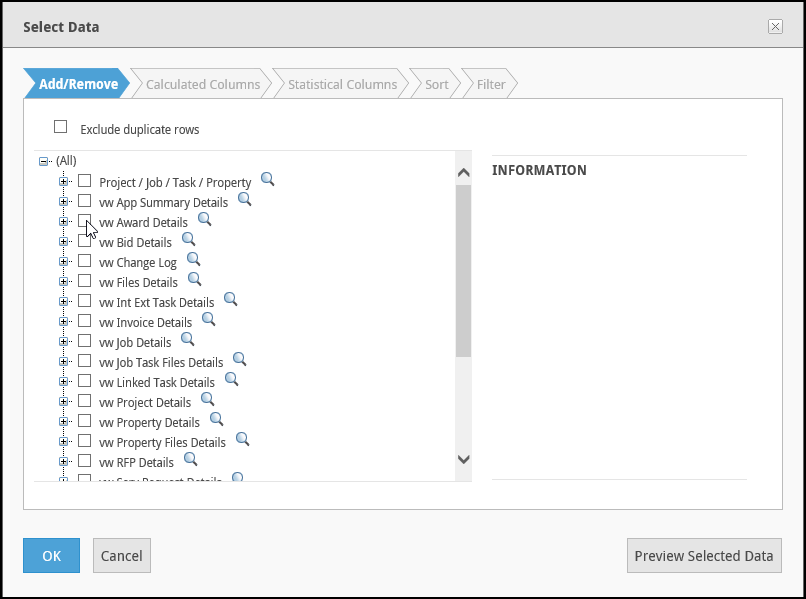
This will focus in on the view selected, showing additional nested items.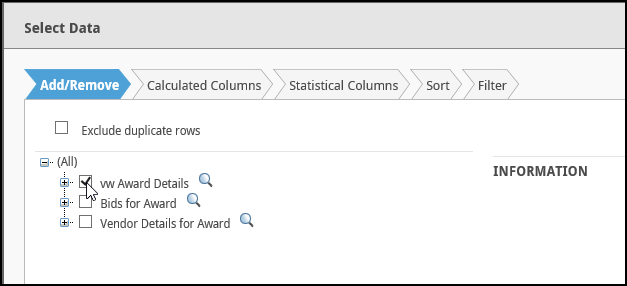
In the example above, Bids for Award and Vendor Details for Award are nested underneath Award Details.
Click additional checkboxes to see more nested items.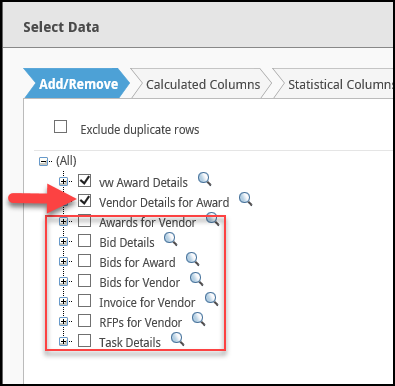
To view the fields included in an item, click the plus symbol (+).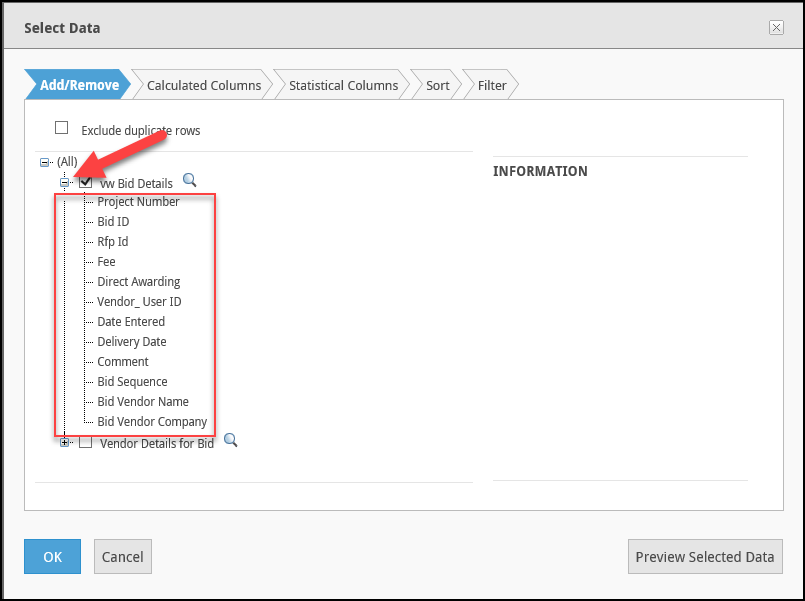
The fields can be hidden again by clicking on the minus symbol ( - ), which will collapse the list.
Once the desired fields have been selected by checking one or more box, preview the data that will be included in the Report by clicking the Preview Selected Data button in the bottom right-hand corner of the screen.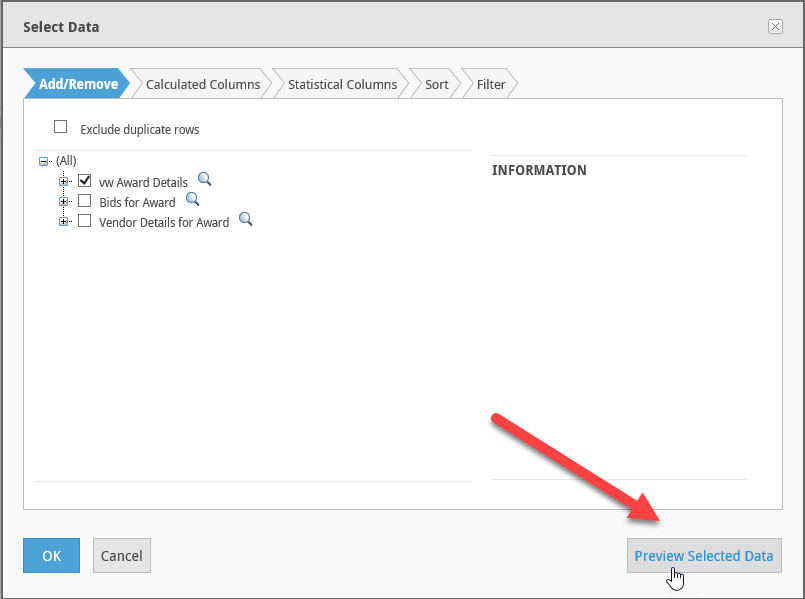
A new screen will open with a preview of the data. Note that this is only a sample, and not the entirety of the data set. The data can also be previewed by clicking on the magnifying glass icon..png)
To finalize the data selection, click Select and Continue. To modify the data selection, click Close.
.png)
