- Print
- DarkLight
- PDF
Report Layout
- Print
- DarkLight
- PDF
The New Report screen contains several buttons that establish the layout of the Report.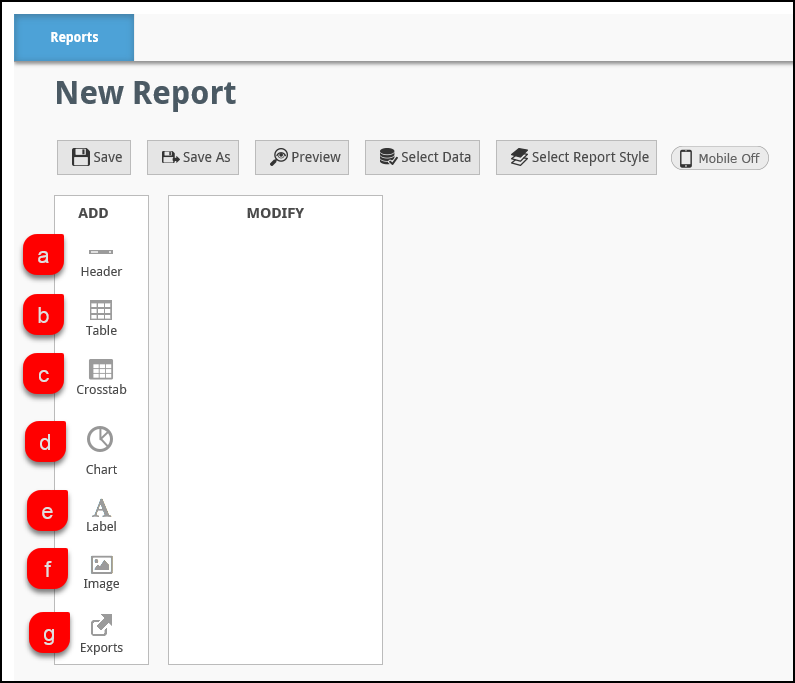
| Function Name | Description | Illustration |
|---|---|---|
| a. Header | Click to add a header row to the Report. Checkboxes allow the user to specify whether the date and/or time are displayed in the header. | 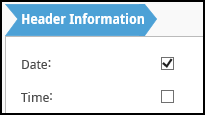 |
| b. Table | Add a table. This is a two-step process, with additional optional steps. First, click on the table button. Next click on the data columns that should appear in the table. Hold ctrl and click to select multiple columns. Once all desired columns have been selected on the left, click the right-pointing arrow to add them to the table. |  In this example, Last Name, Title, Address1 and Zip Code will be added to the table when the right-pointing arrow is clicked In this example, Last Name, Title, Address1 and Zip Code will be added to the table when the right-pointing arrow is clicked |
| b2. Column Config | The Column configuration tab allows the user to define which columns in the selected data will appear in the table when the Report is run. Click the Show All Attributes button in the upper left-hand corner to display the following options.
At the bottom of the page is Add Custom Column. Click this button to add a new column. Once the column has been added, it will appear at the bottom of the list of columns. | 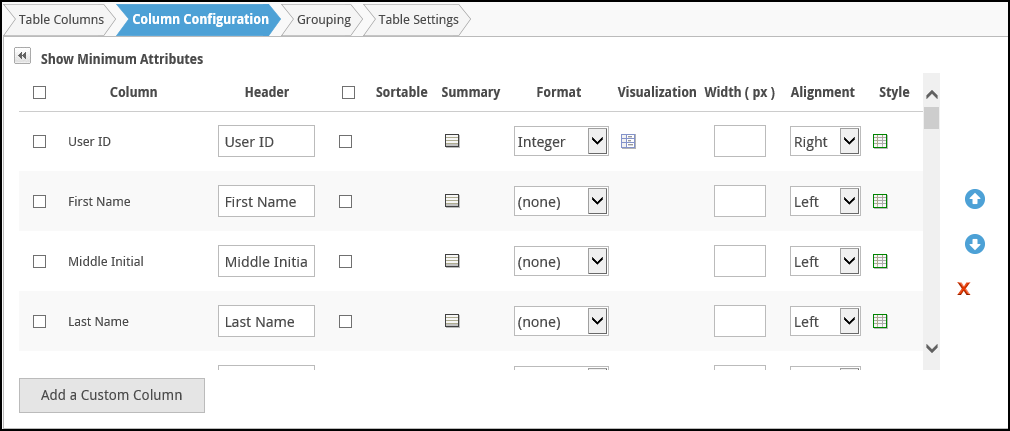 |
| b3. Grouping | By default, the table columns will not be grouped. The Grouping page allows the user to add Grouping layers of two different types.
| 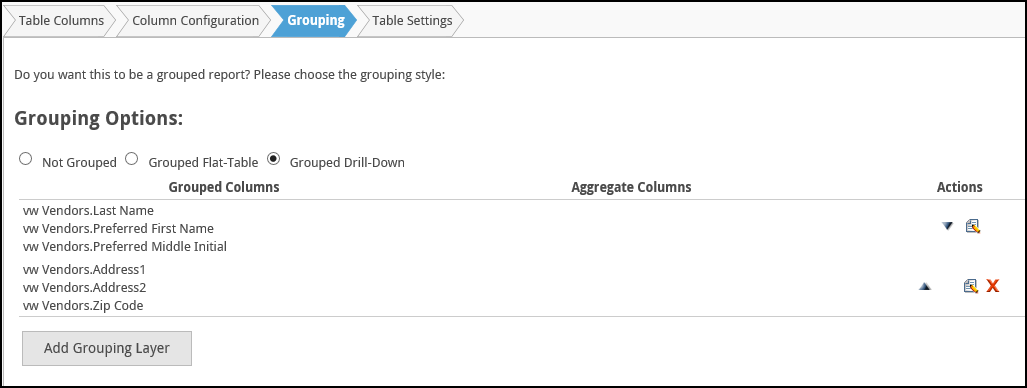 In the above example, two groups of columns have been added. A grouping can be removed by clicking on the red X, or edited by clicking on the paper and pencil symbol. |
b4. Table Settings | Table Settings allows the user to specify settings that apply to the entirety of the data table.
| 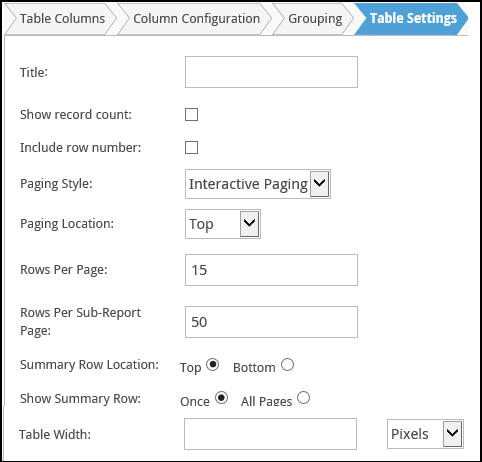 |
| c. Crosstab | Add a header row, label column, and values columns. For example, the header row could be populated with Vendor Specialty, the label column could be populated with Vendors Last Name, while the value columns could be populated with Fees, demonstrating the performance of each JM for a variety of Task codes. The Crosstab Settings tab allows the user to specify additional features for the crosstab table, such as the title and page controls. | .png) In the example above, the data output is previewed below Crosstab Configuration settings In the example above, the data output is previewed below Crosstab Configuration settings |
| d. Chart | Add a chart to the Report. Select one of the chart types and click OK. Once the chart has been selected, there will be additional options based on the chart type selected. | 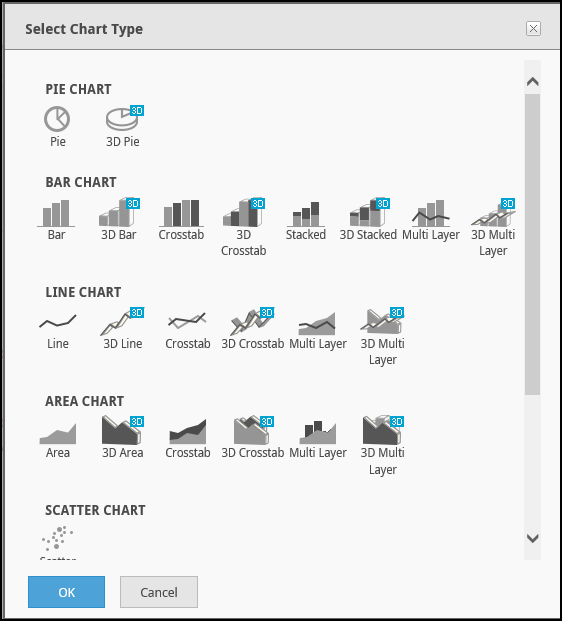 |
| e. Label | Allows the user to specify a label for the data table and determine whether it spans the entirety of the Report (Full Width), or is centered (Simple). Apply a style, such as bold or green with the Style drop-down menu. | 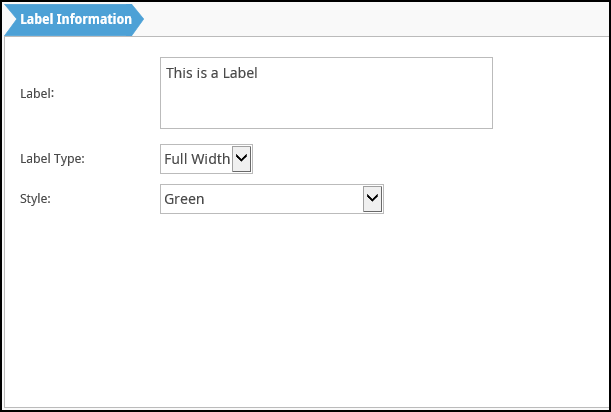 |
| f. Image | Allows the user to upload an image from their computer, or link to one online. A thumbnail of the image will appear on the Image Information tab. Images uploaded in the past can be used again by clicking on the Previously Uploaded button and browsing for the file. |  |
| g. Exports | The Exports button allows the user to add one or more export buttons to the bottom of the Report. If PDF is selected, additional options will appear, allowing the user to specify orientation, paper size, etc. | .png) |
Click the red X next to a Report element to remove it.
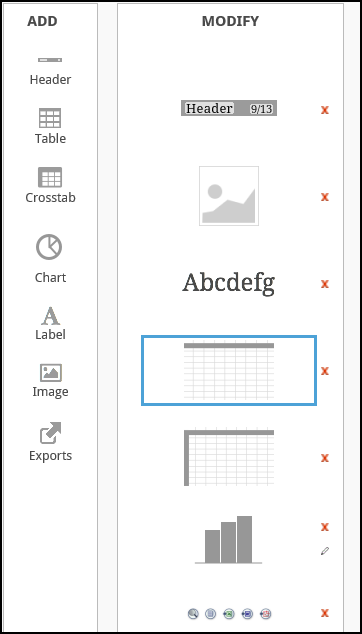
In the example above, one of each of the seven Reports elements has been added.
Once all changes have been made, click the Save button in the upper left-hand corner of the screen. Or click the Save As button to save a copy of the Report with a different name.
.png)
