- Print
- DarkLight
- PDF
Fee Summary
- Print
- DarkLight
- PDF
The Fee Summary Report includes Job-level information on vendor fees, internal fees, handling fees, and total fees. The report can also be used to track fees recovered from the borrower, fees waived by lending group, as well as unrecovered fees.
Performing a Search
The Fee Summary Report allows users to specify search parameters.
The first block of search filters relates to the date range.
By default, the Login Date From field(s) will auto-populate with the beginning day and ending day of the previous month. There are several date-related options.
- Job Logout Date From/Task Complete Date From - Select one of two options from the drop-down menu. Job Logout Date is the date on which a Job
- is closed; Task Complete Date is the day on which a Task is closed.
- Date From/To - Specifies the date range for which results should be returned.
- [Or selected Date Range] - Allows users to search using predefined ranges, such as Last Week and Quarter to Date.
The next set of filters includes Lending Groups and Account Officers.
In the example above, 2 Lending Groups and 3 Account Officers have been selected.
Beside each field is a magnifying glass. Click the magnifying glass to quickly search through the available options for that category. It's possible to include more than one Lending Group or Account Officer by holding the CTRL key while clicking on the desired selections. Click on the [All] button to include all Lending Groups or Account Officers; click [None] to include none (deselecting all that have been selected).
The final block of filters allow the user to further narrow the results..png)
Note that results must match ALL filter criteria entered. For example, if a Borrower Name and Billing Cost Center are entered, only results matching both will be returned.
Click Select Columns to define which data fields will appear within the report.
A new window will open with all of the possible columns listed. Note that you may see some fields/columns your institution does not use.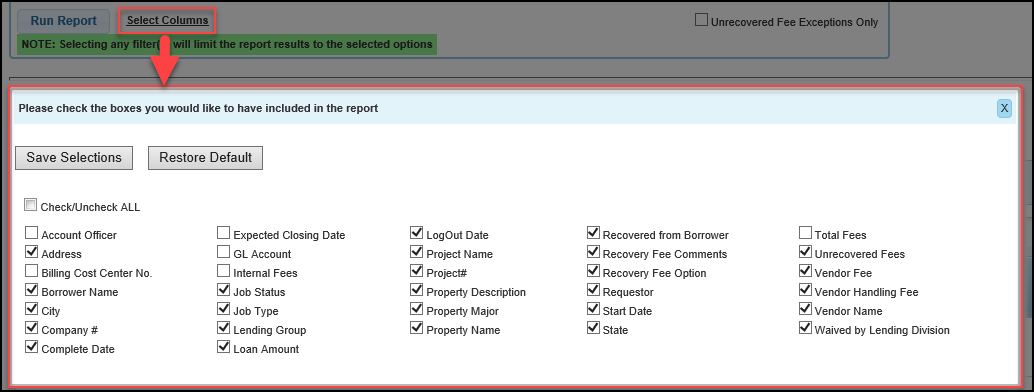
There are two buttons at the top of the screen.
1. Save Selections locks in the column selections and prepares them for use in a new generated report.
2. Restore Default will select only the options that are standard Fee Summary Report options.
IMPORTANT: Saving Selections here will reset your saved layout to default settings, removing customized column order, formulas, filters, groupings, etc.
Viewing the Data
Click Run Report to generate a report using the Report Filters above, displaying only the column data designated using the Select Columns tool.
The table is configurable. Click a column header to see three options:
1. Click and hold the six dots on the left to drag and drop the column in a different position.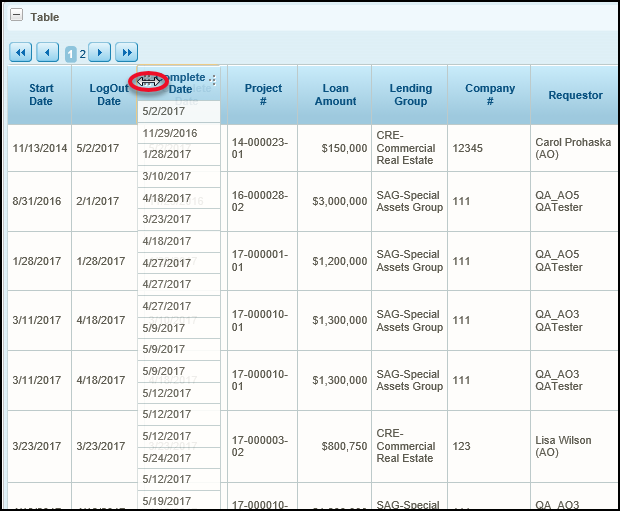
2. Click and drag the four arrows on the right side of a column header to increase/decrease the column width.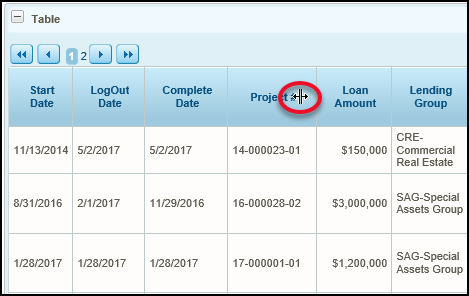
3. Click on a column header title to sort the table by that column in ascending or descending order.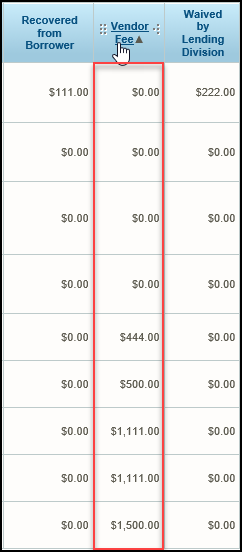
Functions
There are eight total functions that can be used to manipulate the data table..png)
| Function Name | Description | Illustration |
|---|---|---|
| Formula | Formulas are expressions made up of columns, constants, functions, and operators. For example, a formula can be used to multiply two columns by one another to produce a numerical product. When creating a formula, each column is represented by the column name encased by parentheses (i.e. [Lending Group] ). Columns may be divided, multiplied, added, or subtracted by one another. The Insert a column drop-down contains a list of usable columns contained within the Fee Summary report. Select the appropriate Data Type to categorize the type of formula being created. For example, if the formula exclusively contains numerical data, select Number from the dropdown. Data Format configures how the formula will be displayed once calculated. | 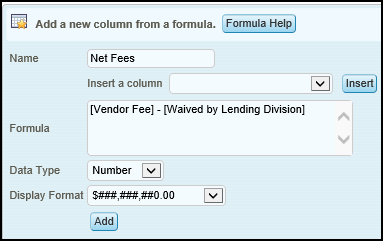 |
| Sort | Click Sort to specify a Data Column and determine whether it should be sorted in Ascending or Descending Order. Clicking on a column header produces the same outcome, but this feature is useful for larger tables that feature many columns. | 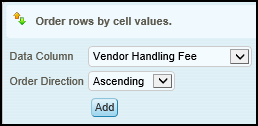 |
| Filter | Filters provide additional filtering to help illustrate data within a large table. For example, a filter could be added to only display results where the Vendor Fee is greater than $1,000. |  |
| Group | Group takes one column and places associated columns within it. For example, choosing to Group Lending Group would look at each unique instance for every Lending Group in the table, and then place matching instances together. | 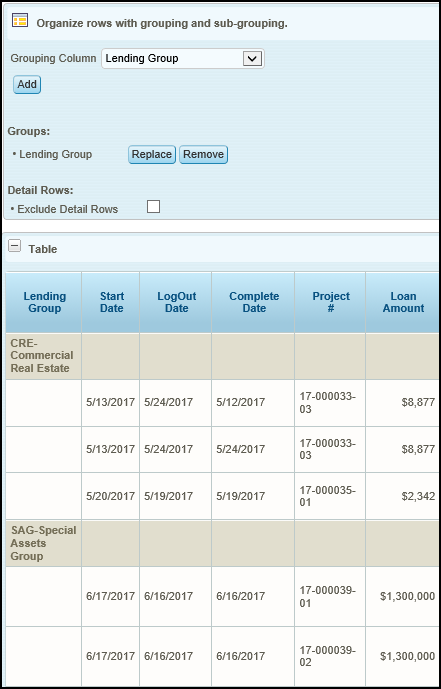 |
| Aggregate | Aggregate calculates totals, averages, etc. For example: look at the average Vendor Handling Fee. This function works in tandem with grouping, as the calculation will be performed for each group independently. | 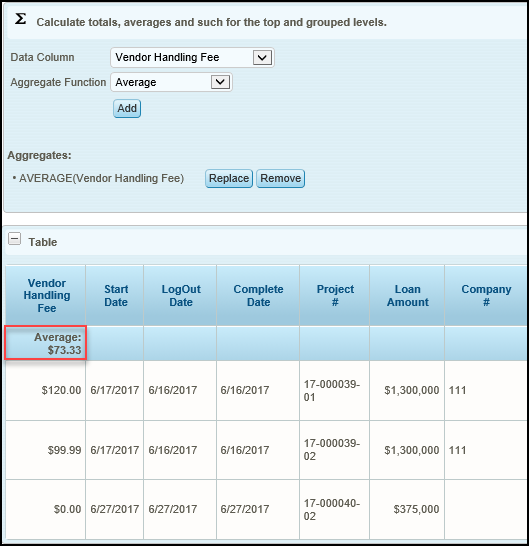 |
| Chart | Charts graphically illustrate the data. The available chart types are: Pie, Bar, Line ,Curved Line, Scatter Plot, Heatmap, and Gauge. Charts cannot be exported, and are only viewable from the Fee Summary Report page. | 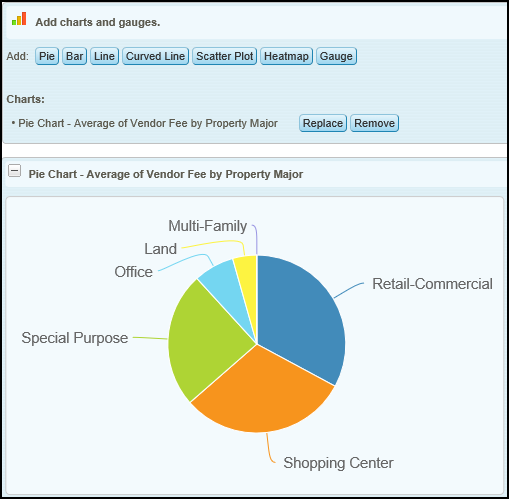 |
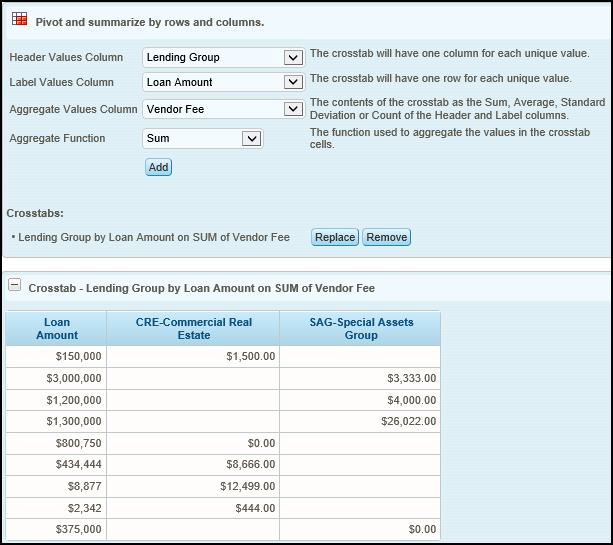
| Crosstab | Crosstab allows users to pivot and summarize by rows and columns. There are four fields to consider when using Crosstab:
|  |
| Paging | Paging controls how many results will appear per page within the table. Transition between pages by using the navigation arrows at the top of the table. | 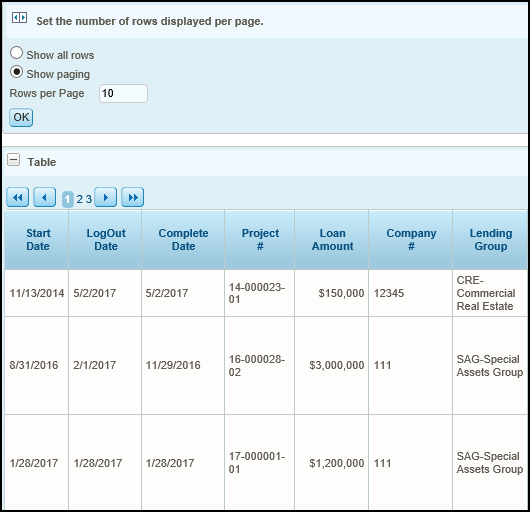 |
Exporting Data
Click on one of the Export buttons in the upper right-hand corner of the window to export a copy of the table. Exporting to Excel will maintain the functional changes applied to the table, such as grouping and aggregating data fields, while the CSV export option will not.
.png)
