Market View Workspace
- Print
- DarkLight
- PDF
Market View Workspace
- Print
- DarkLight
- PDF
Article summary
Did you find this summary helpful?
Thank you for your feedback!
Overview
Market View is your gateway to real-time (or near real-time) insights across the commercial real estate (CRE) landscape. The platform brings together market data, trends, and analytics to help you evaluate performance across property types, geographies, and investment metrics.
Whether you are tracking key indicators, benchmarking markets, or identifying emerging trends, Market View provides a clear and interactive way to explore market dynamics and inform smarter decisions.
Accessing the Market View Workspace
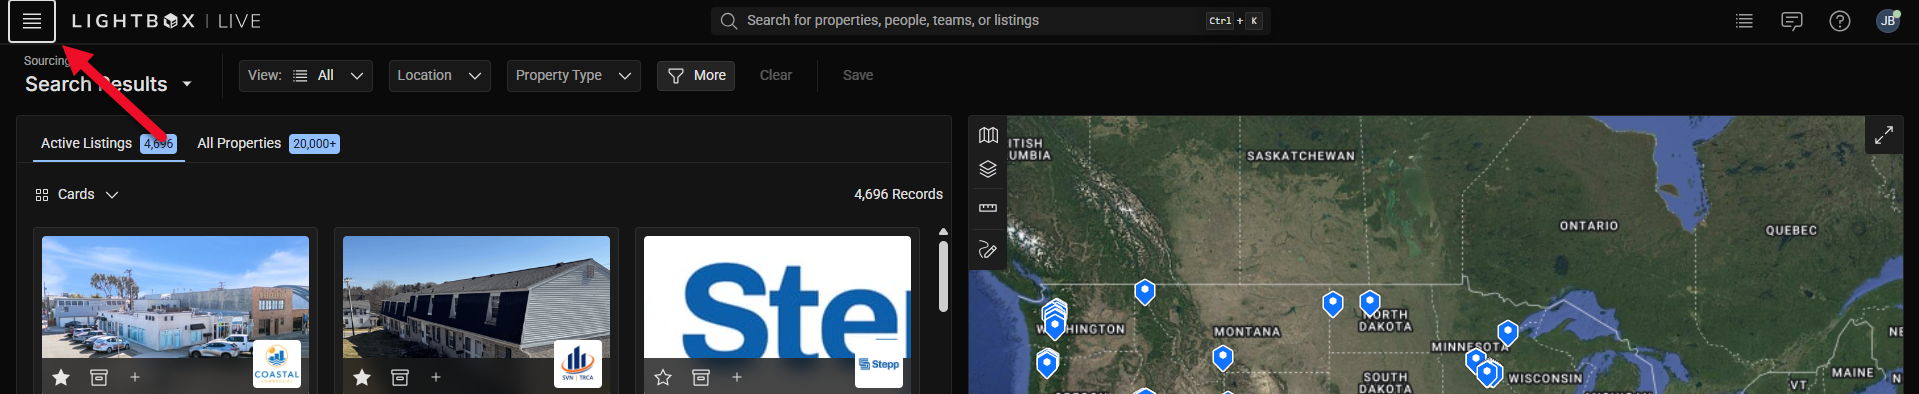
The Sourcing Workspace is the home page for LightBox Live - Investor users. To access the Market View Workspace when you are on the Sourcing Workspace, follow these steps:
Click the options icon (four horizontal lines) located in the top-left corner of the Sourcing page.
In the workspace menu that appears, click the Market View button.
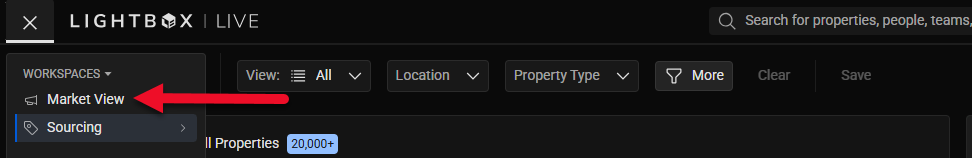
The Sourcing Workspace will open.
Tip: You can move between workspaces (such as Market View and Sourcing) at any time using this same menu.
Navigating the Market View Workspace
The Market View interface provides interactive tools for exploring market analytics. The following guide outlines the main components you will encounter.
NOTE
Please note that layout and available features may evolve as the platform continues to improve.
The Market View Dashboard provides a snapshot of the most important market indicators—such as vacancy rates, cap rates, and rent growth—across major property types and regions.
Quickly gauge overall market conditions and performance trends.
Identify which sectors or geographies are gaining or losing momentum.

The five sections in the Market View workspace are as follows:
U.S. Macro Data
News Feed
U.S. Market Sentiment
Recent Transactions
Market Volume
U.S. Macro Data
The US Macro Data widget presents key macroeconomic indicators relevant to commercial real estate, such as the 10‑Year Treasury rate, inflation, employment, GDP, and industrial production. The main chart displays the selected indicator over time. Click on the individual metric cards below the chart to switch between different macro data elements and view their respective trends and current values. |
|

News Feed
The News Feed widget displays a curated list of recent news articles related to commercial real estate markets, capital activity, policy, and development. Headlines are shown with timestamps and can be expanded to view summaries when available. Users can browse the feed to stay informed on market‑moving events and to add context to trends observed elsewhere in Market View. Access the summary by clicking the caret on the right side of each row, and access the full article at its source by clicking on the headline, which will take you to a new tab in your browser. |
|

US Market Sentiment
The US Market Sentiment widget displays an AI-generated summary of current U.S. commercial real estate conditions based on recent transaction data, pricing trends, sector activity, and relevant news. The content updates twice daily as new data becomes available. Users can read this section to quickly understand prevailing market themes, recent shifts in activity, and important data considerations such as seasonality or reporting timing. |
|

Recent Transactions
The Recent Transactions widget lists recently closed commercial real estate transactions in a table format. Each row includes the property name, address, property type, transaction amount, buyer and seller, date recorded, and price per square foot when available. Users can scroll through the table both vertically and horizontally to review recent deal activity and use it as a reference for pricing, active buyers, and comparable transactions. |
|

Market Volume
The Market Volume widget shows quarterly transaction volume by property type, broken out by Listed Volume and Closed Volume. The line chart allows users to see how market activity has changed over time and compare supply versus executed demand. Users can select different property types from the selector below the chart to update the visualization and review trends specific to each asset class. |
|

Was this article helpful?