LightBox Live - Environmental: Quick Start Guide
- Print
- DarkLight
- PDF
LightBox Live - Environmental: Quick Start Guide
- Print
- DarkLight
- PDF
Article summary
Did you find this summary helpful?
Thank you for your feedback!
Getting Started
LightBox Live brings together a streamlined interface, new content, and powerful capabilities – all in one place. The improved workspace is easy to learn and easy to use, enabling you to streamline your processes, make better-informed decisions, and deliver your best work with ease.
Getting Oriented
The new interface is easy to learn and easy to use.
Content layers are available in the top left, above the map.
Map layers are available in the Layers Menu in top left of the map.
Your reports are available for download in the Project menu, under the address in the top left.
We have added a new in-app chat feature, which enables you to contact us via chat. Click the Question Mark in the top right.
Streamlined Design
The new, modern design will help you move through large quantities of content with ease.
Enjoy the modern, dark theme. Many users today are already working in dark theme on other applications and documents.
Frozen database headers allow you to know which database and sub-table you are currently viewing. This feature works automatically as you scroll through the data, which can be particularly helpful in longer documents. Try out the Hide not reported fields option in the Text Detail Card. This toggle option (on/off) will save you time by hiding unimportant or redundant information.
Open multiple tables at the same time to see and compare different types of data, such as environmental records, assessor record lists, and water wells. The new Timeline lets you see a full historical view of Sanborns, Aerials and Topo maps and compare the property uses from different sources.
New Content
Additional content in LightBox Live enables you to better identify potential issues and minimize time switching between sources, so you can more reliably advance from data to insight.
Tax Parcels
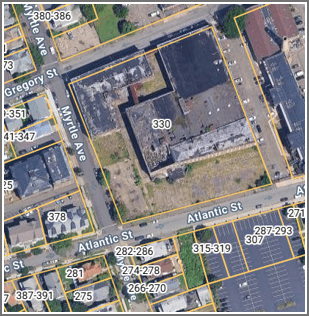 We now collect tax parcel data from every county in the United States, with the majority of top 500 counties being updated quarterly.
You can annotate tax parcels with the address number, APN, owner last name, owner full name, or owner name + address number. To choose the annotation method, select from the layer menu on the top left of the map.
Detailed assessor fields are now available by clicking on any tax parcel or through the Assessor List from the content ribbon, under Other Records.
Street View
Historical Street View has been added right within LightBox Live. Coverage goes back to 2007 (where available), so you can get a better view of the property history.
Soil Types
Soil types are now much easier to review in LightBox Live. The revised map presentation covers a larger geographic area, and the text detail is better organized for quicker reading. The presentation is similar to the Natural Resources Conservation Service – USDA / Web Soil Survey.
New Tools
Cutting edge ‘adjoining research’ and measuring tools make it easier than ever to accomplish your goals quickly and accurately.
Area of Interest Tool
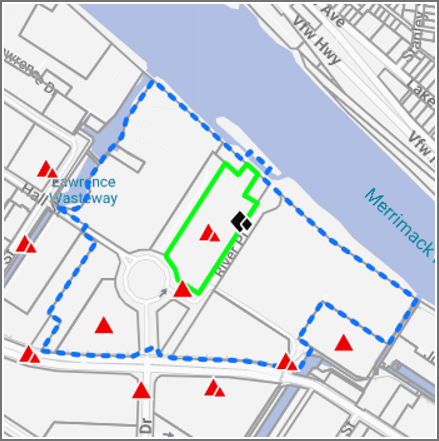
We are proud to introduce the new Area of Interest Tool (AOI). The AOI Tool is the first mapped-based technological solution to help identify adjoining properties per the adjoining property language in ASTM 1527-21 .
“3.2.4 adjoining properties, n—any real property or properties the border of which is contiguous or partially contiguous with that of the subject property, or that would be contiguous or partially contiguous with that of the subject property but for a street, road, or other public thoroughfare separating them.”
Using the LightBox SmartFabric of tax parcels, building footprints and ownership information, along with street networks, the AOI tool displays the boundary of the adjoining properties and flags environmental records within the area. To begin using the AOI Tool, click the Tools menu in the top right corner of the application. For additional details, see Area of Interest (AOI)Tool.
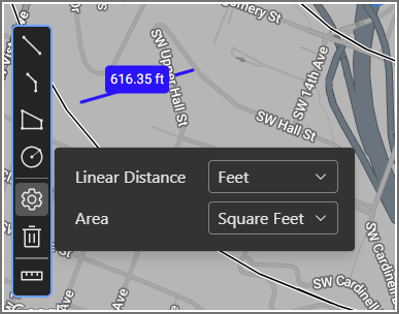
Improved Measuring Tools
There are four types of tools: line, polyline, polygon, circle. Units default to feet, but can easily be changed to other units by clicking the gear icon (feet, miles, meters, kilometers; sq feet, sq meters, sq kilometers, acres, hectares).
Distance, area, and perimeter are annotated on the map, and you have the option to hide / show measurements on the map. Measurements are saved, so if you close the application and come back later, they will remain stored. While you are actively measuring, other actions in the application may be limited.
Was this article helpful?