Heatmap
- Print
- DarkLight
- PDF
Heatmap
- Print
- DarkLight
- PDF
Article summary
Did you find this summary helpful?
Thank you for your feedback!
Get a better understanding of the density of data in your area with the Heatmap command. Generated from any layer or Results List, this command will create a heatmap that allows for a quick assessment and quantification of information.
How to Create a Heatmap from a Layer
Heatmaps can be created from any layer by selecting the layer option Create Heatmap. Read the full list of steps below.
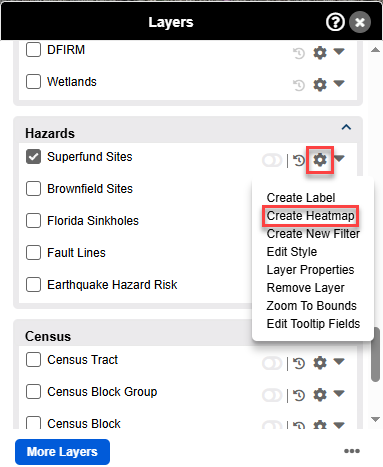
1. Select the Layer Options Icon on the layer that you would like to generate the heatmap from.
2. Choose the Create Heatmap option.
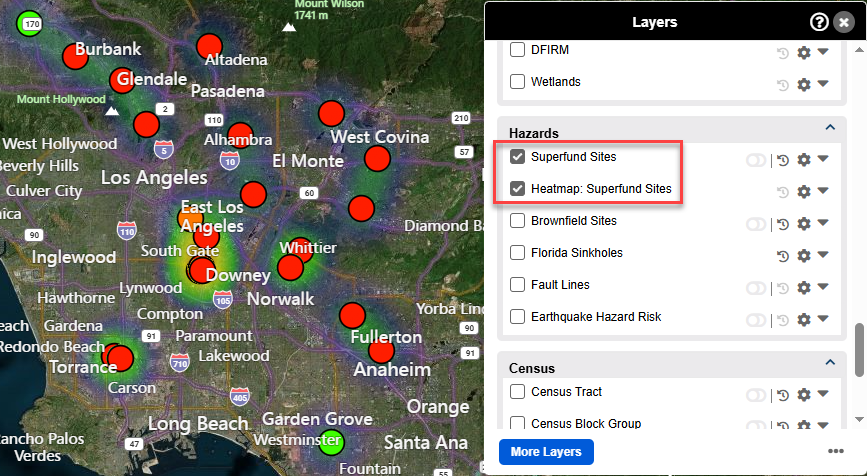
3. A new layer will be created with the Heatmap and it will automatically be turned on for viewing.
Note:
You can edit the style of the heatmap to change the intensity, and weight of each point. The default colors refer to warm colors like red/orange/yellow as areas of higher density of data with green/blue/purple being lower density areas. These colors can be configured manually so please read further below to learn how to edit the style or appearance of the heatmap.
Viewing and Managing Heatmaps for the Results List
Results Lists can also be represented as heatmaps by toggling the Heatmap Command at the top of a Results List.
1. Add your search results to the Results List, or open a saved Results List.
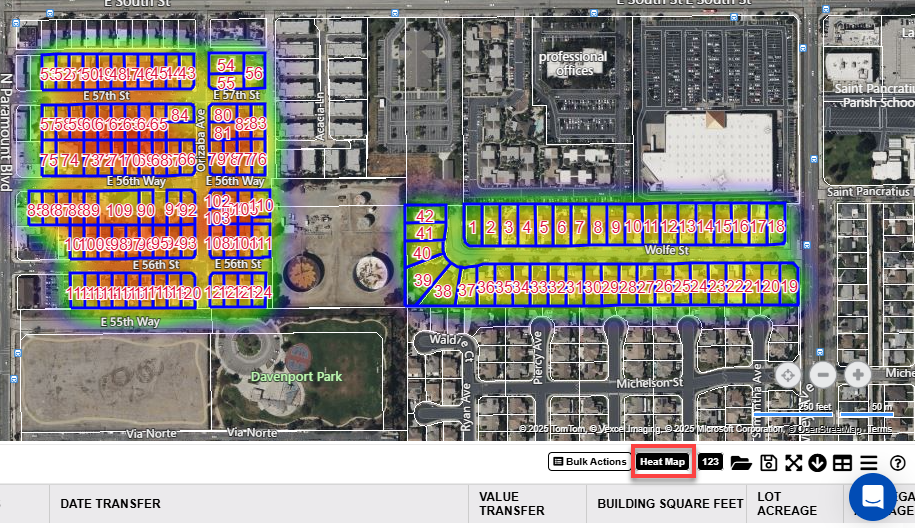
2. Click the Heatmap icon from the Results List commands.
3. Your results list displays as a heatmap indicating the concentration of the records in the list. The heatmap representation of the list can be toggled on and off by clicking the Heatmap command again.
Editing the Style of the Heatmap Layer
If you generated your heatmap from the layer options, follow these steps to edit the style of your heatmap to change the appearance of it:
1. Click on the Options Icon on the heatmap layer, and select Edit Style. The style editor window will open.
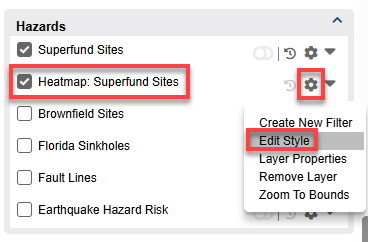
2. With the style editor window open, you have the option to edit the Intensity, Opacity, and Size.
- Intensity: Changes the weight of each point.
- Opacity: Selects the translucence of the layer.
- Size: Affects the size of the heatmap around each feature on the map.
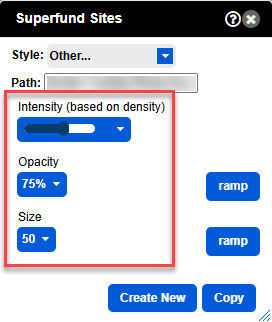
3. When you're done editing the style. Close the window, and the style will save for you automatically.
Editing the Style of the Heatmap from the Results List
If you generated your heatmap from the results list, follow these steps to edit the style of your heatmap to change the appearance of it.
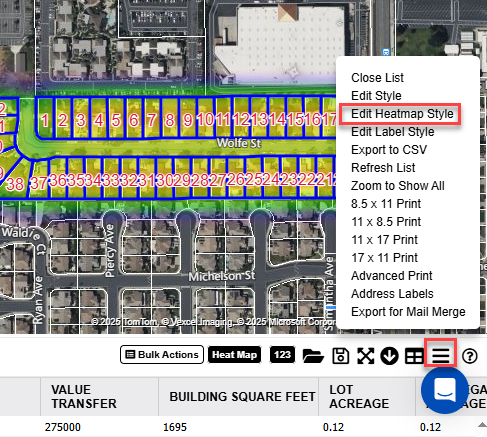
1. Click on the Results List options icon and choose the Edit Heatmap Style option. The style editor window will open.
2. With the style editor window open, you have the option to edit the Intensity, Opacity, and Size.
- Intensity: Changes the weight of each point.
- Opacity: Selects the translucence of the layer.
- Size: Affects the size of the heatmap around each feature on the map.
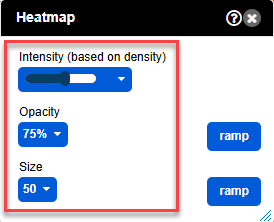
3. When you're done editing the style. Close the window, and the style will save for you automatically.
Printing the Heatmap
Utilize our Print option from the Main Toolbar at the top of LightBox Vision to get a PDF image of your Heatmap if a Heatmap layer was created. If a Heatmap was made from a list, the list options icon above the list (the icon is 3 horizontal lines) will have print options to choose from.

Use the Advanced Print option with Heatmap layers enabled to do things like add a header/footer to the page or include a layer legend of information on selected layers.
Printing Heatmaps is supported in the following browsers:
Chrome, Firefox, and Safari.
Export Image:
Not currently supported.
Note:
You can use an external screen capture tool to take a snapshot of your map in LightBox Vision.
Was this article helpful?