Demographic Data
- Print
- DarkLight
- PDF
Demographic Data
- Print
- DarkLight
- PDF
Article summary
Did you find this summary helpful?
Thank you for your feedback!
LightBox Vision™ provides you with a rich resource for Demographic Data which is defined by census groups (see below for more details) containing over 300 attributes and the tools to use it effectively. The Demographics dataset is provided to LightBox Vision by a vendor who undergoes annual updates with this information. Demographics in LightBox Vision comes standard with the Commercial and Builder editions but can purchased as an add-on for Enterprise accounts.
Three layers that reflect the most commonly utilized demographics data (Population Density, Age, and Household Income) are provided by default in the layers panel for your convenience.
Additional pre-defined styles in the layer options provide you with more customized maps of Demographic Data. To fit your specific needs, you can also create new styles to display data. Searching the demographic data is also possible through the Demographics search filter.
Note:
The Demographics data comes standard for the Commercial and Builder editions of LightBox Vision. For the Enterprise edition, it can be purchased as an add-on.
LightBox Vision Demographic Data is aggregated at the block group level and the US Census Bureau provides three levels of Demographic Data:
Block: A statistical area bounded by visible features such as streets, roads, streams and railroad tracts, as well as by non-visible boundaries, such as selected property lines and city limits. A block is the smallest geographic unit for which the US Census Bureau tabulates 100-percent data.
Block Group: Generally contains between 600 and 3,000 people. It is the smallest geographic unit for which the US Census Bureau tabulates sample data. Block Group is a statistical subdivision of a tract.
Tract: Contains on average about 4,000 inhabitants. A small, relatively permanent statistical subdivision of a county.
Identify Demographic Data
To pull up the demographic details for an area you will need to identify it on the map. Follow the steps below to identify:
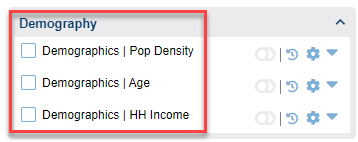
1. Turn on the Demographics layer by clicking the checkbox on the layer in the Layers Menu.
Three Demographics layers have been provided by default.
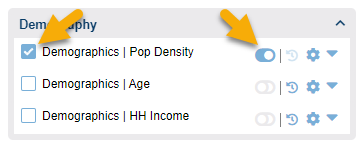
2. Enable one of these layers by check-marking it and toggle the Tooltip on.
3. Hover over the region you would like to identify and select the demographics layer from the tooltip. By default, the tooltip for the demographics layer displays the population density.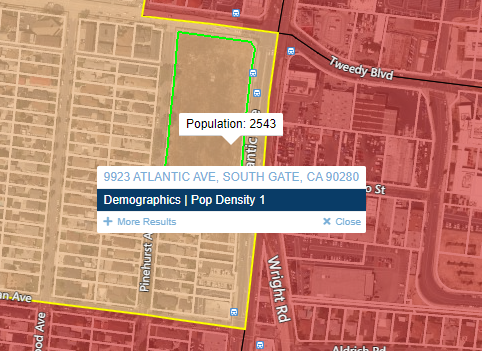
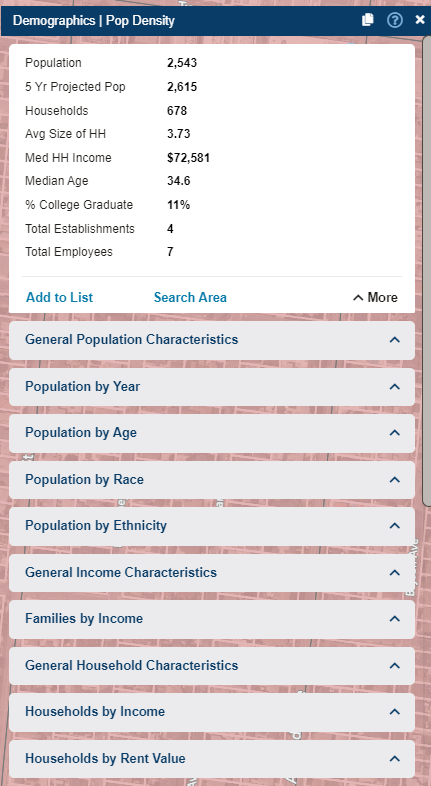
4. The Location Information panel will open with the Demographics Data. You can click on additional categories within this panel to see more data.
Selecting a Style for the Demographics Layer
LightBox Vision™ contains many powerful pre-defined demographic styles. Here are just a few of the styles based on income: Med. Income - Working Class, Income - Upper Class, Med. Age And Income - Generation X, Med. Household Income, Income and Males, Income and Females, etc. Each is a visual theme that provides market insights. To switch between styles follow the steps below:
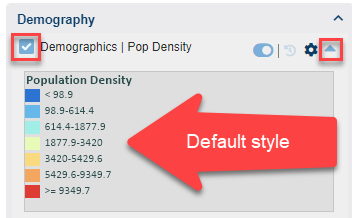
1. Turn on the Demographics layer by clicking the checkbox on the layer in the Layers Menu. The layer will have a default style assigned to it but it can be changed.
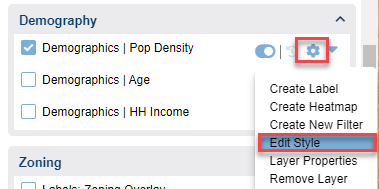
2. Click the Layer Options icon on the Demographics Data Layer.
3. Click Edit Style in the menu. The Style Editor appears.
4. Choose the ramp button next to fill color to pick a different set of colors.
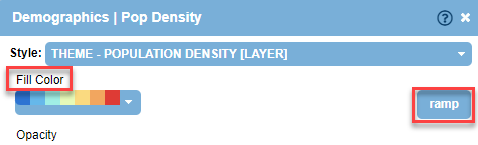
5. After you select the style to display on the Ramp Editor window, you can choose OK and the new coloring will reflect.
To restore any of the three provided layers back to their default style, use the Style drop-down list and select the style for the appropriate layer below:
Demographics | Pop Density:
THEME - POPULATION DENSITY [LAYER]
Demographics | Age:
THEME - MEDIAN AGE [LAYER]
Demographics | HH Income:
THEME - MED.INCOME - ALL CLASSES [LAYER]
Searching for Demographic Block Groups
LightBox Vision™ enables you to search the Demographic Data using predefined search filters. The LightBox Vision™ Demographic Data search filter categories are Location, Population, Race & Ethnicity, Households, Housing Units, Income, Age, Spending, and Employment.
1. Click the Search icon from the Main Toolbar. The Search Filter window appears.

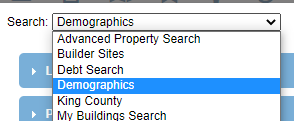
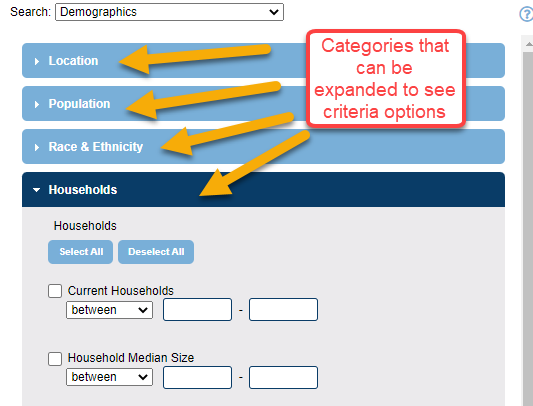
2. Select Demographics from the Search drop-down list. The window displays nine categories of Demographic Data search filters.
3. Select your desired search filter criteria (or leave everything unselected if you have no specifications) from the categories. Click the category's box to expand and see the criteria options.
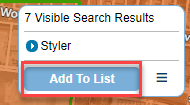
4. Click OK to run your Demographic Data search. Your search results appear on the map as the data within the Block Groups are counted in the Search Results box and you can Add to List to view its data.
Tip:
Use the Search Filter bar to quickly adjust your search filter criteria. It appears as a shortcut below the Main Toolbar after you have chosen the Demographic search filter as your focus filter.
5. Alternatively, to see Demographic data individually you can click on any Block Group polygon to view details when you have the layer for it enabled. The Location Information Panel opens with Demographics data for that Block Group.
Was this article helpful?