Additional Default Layers
- 28 Sep 2023
- Print
- PDF
Additional Default Layers
- Updated on 28 Sep 2023
- Print
- PDF
Article Summary
Share feedback
Thanks for sharing your feedback!
LandVision comes with many datasets which can be found in the Layers Menu and some of these contain corresponding search filters which can make it easier to do research on your market area. Whether it is viewing topography or checking out hazards, LandVision can assist you with making informed decisions that can benefit your targeted audience.
Note:
If your account does not have these layers, please reach out to support-dmp@lightboxre.com to inquire
Buildings
If there's a need to see further details about a building, then this nationwide dataset provided by Building Footprint USA (BFUSA) can be enabled in LandVision in order to view information such as building height, square feet, elevation and more. Simply turn on the layer and its corresponding tooltip to then select one of the blue building outlines to gather these metrics.
Note:
This layer will be visible on your map at a maximum of 100ft overhead and cannot be viewed at a higher range or included in search filters

Note:
For more ways to view Building information, please check out our additional products click here.
Building Addresses
The sister dataset for the BFUSA Buildings is this additional layer that focuses on the building addresses. The addresses are represented by color-coded points on the map (blue for primary addresses and yellow for secondary addresses). These points can be selected to view a list of related addresses and give a link to the data in the Buildings layer.

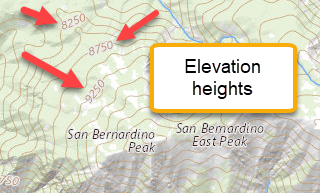
Topography
This nationwide layer is provided by the United States Geological Survey (USGS) and the contour lines give elevation height that can assist our customers on assessing hazard and climate risks or deciding on ideal areas to develop on. When enabling this layer in LandVision, the viewing level on the map should be within 1 mile overhead to see the labeling displayed. Zooming in on the map will provide more elevation results.
For a reference on what the USGS symbols mean, please view their site here.
Note:
This is a static layer for visualization purposes. There are no features to select.
Earthquake Hazard Risk
Seeing the earthquake potential of any location in the U.S will give our clients the knowledge of areas of high risk vs low risk. The USGS has compiled nationwide polygons that display in LandVision and are color-coded according to their risk levels.

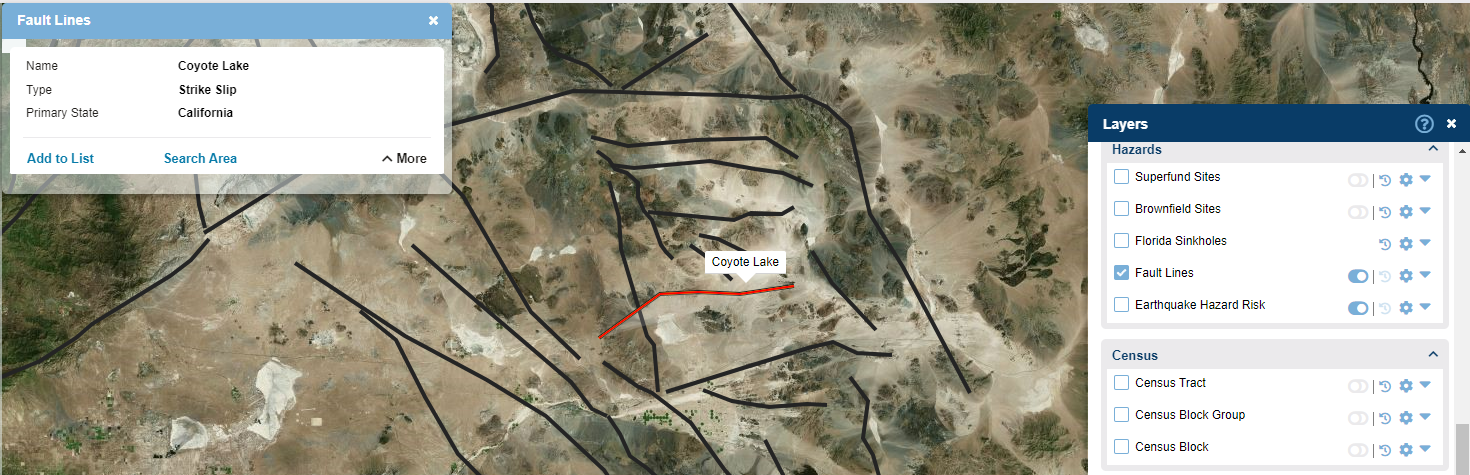
Fault Lines
To compliment the Earthquake Hazard Risk layer, the USGS also has provided this dataset that details nationwide fault lines. This gives information such as the name of the fault and what kind it is.
For further details on the USGS definition of faults, please reference their site here.
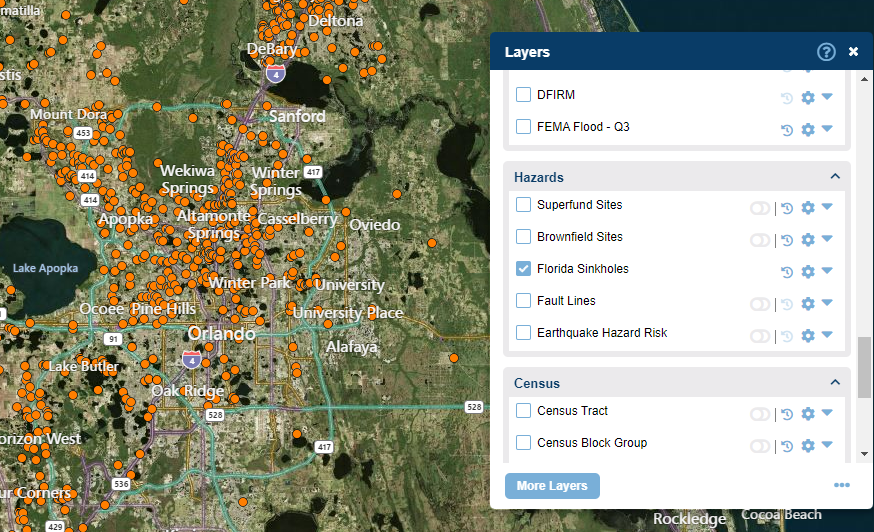
Florida Sinkholes
Due to the type of rock terrain and high amount of water saturation, Florida is amongst the top states in the nation that will have sinkholes in it. Because of this, the USGS has provided a sinkhole point layer that resides in LandVision and can help make land development decisions.
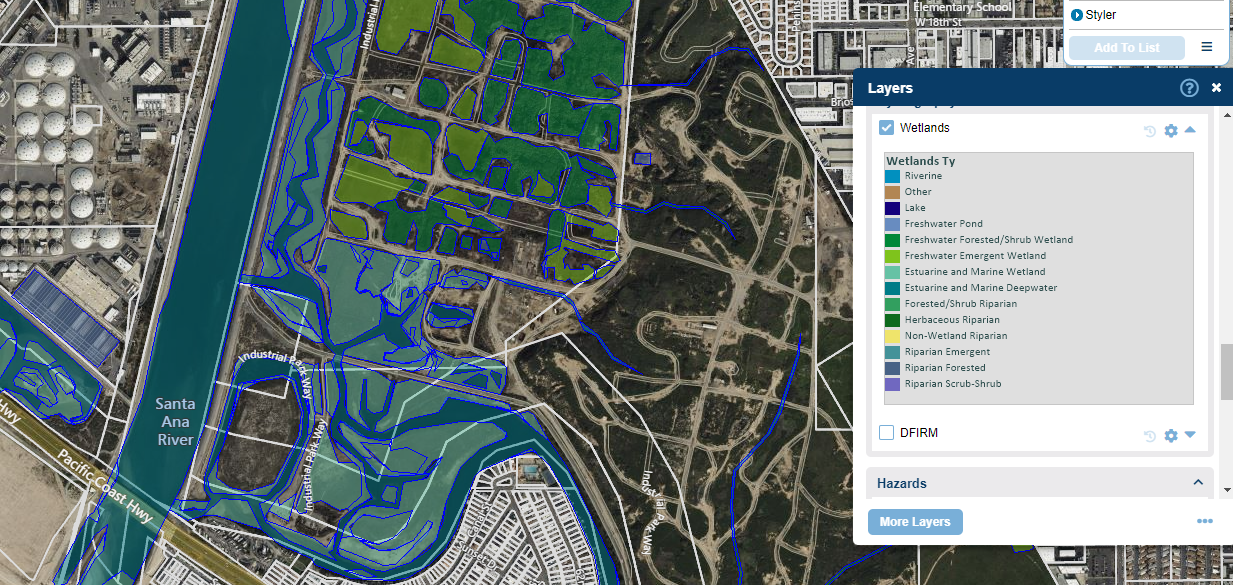
Wetlands
The United States Department of Fish & Wildlife (FWS) provides this dataset that can be viewed in LandVision from your Layers Menu. These areas may prevent or hinder developmental plans.
To see a reference of how the FWS classifies wetlands, please see their site here.
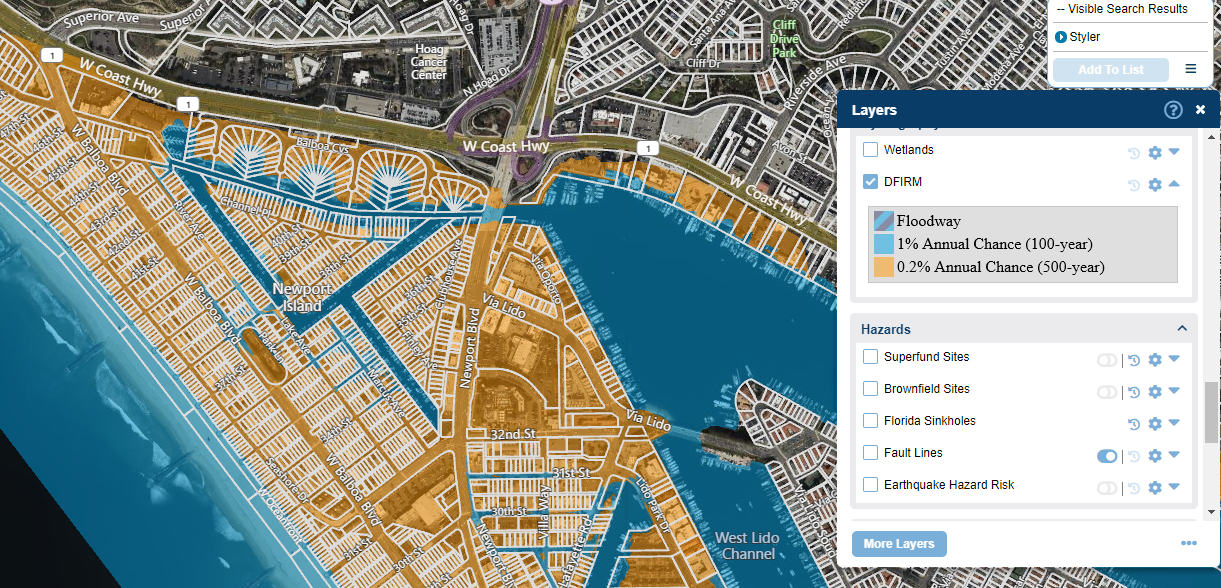
DFIRM
Knowing whether a site will be impacted by flooding will help our clients navigate their market areas. The Federal Emergency Management Agency (FEMA) is the source for providing the Digital Flood Insurance Rate Map (DFIRM) as a dataset that can be enabled in LandVision.
Note:
The Parcel Card of your subject property can also be leveraged to view the Hazard level and its flood code. To see FEMA codes, please visit their site here.
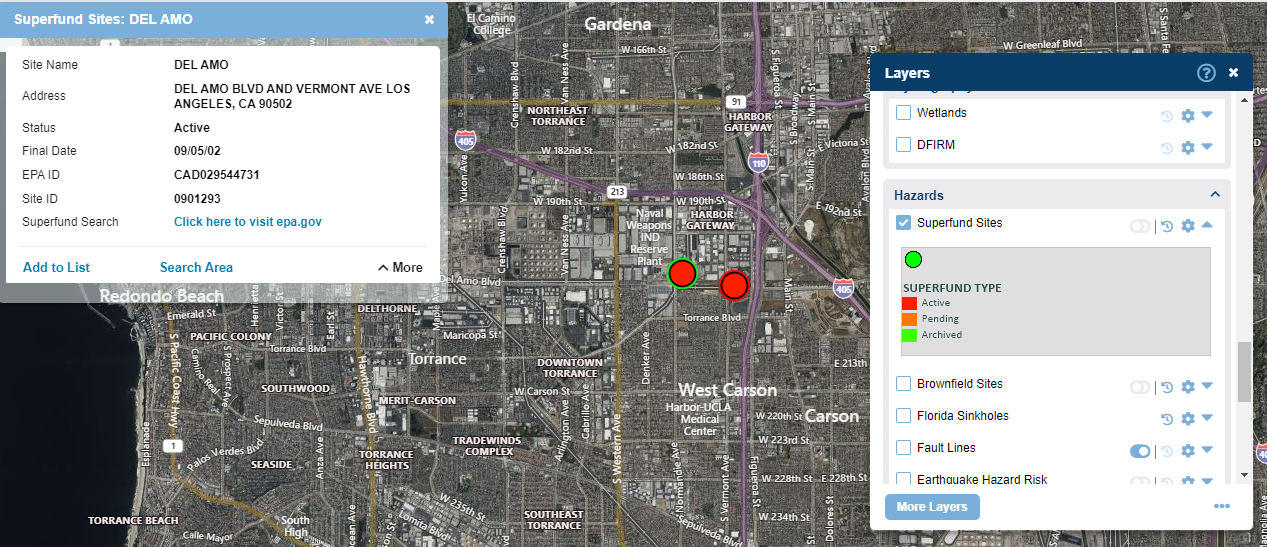
Superfund Sites
Provided by the Environmental Protection Agency (EPA), this dataset is visible in LandVision as color-coded points represented on the map where contaminated sites are either active, pending, or archived. When one of these points are selected, it will provide the name of the site, address, status, final date, EPA ID, Site ID and a link to the EPA website.
Brownfield Sites
To compliment the Superfund dataset, LandVision has also acquired the EPA's Brownfield Sites. These sites are defined as areas that may be compromised by the potential of a hazardous substance, pollutant or contaminant. This layer of data is also represented by points that can be selected on the map in order to view the site description, registry ID, location, unit code, creation date, and a link to the facility.

Was this article helpful?