- Print
- DarkLight
- PDF
Advanced Reports
- Print
- DarkLight
- PDF
Purpose
This documentation describes how to manage, run, create, and schedule reports using Advanced Reports.
Audience
Job Managers, Lender Managers, Content Administrators, and Lender Executives.
Advanced Repots Overview
Collateral360 Advanced Reports is a robust suite of reporting tools. It includes pre-built reports, a scheduler, and report-builder tools.
Access Advanced Reports
To access Advanced Reports, click on Reports in the upper navigation bar and then click Advanced Reports in the drop-down menu.
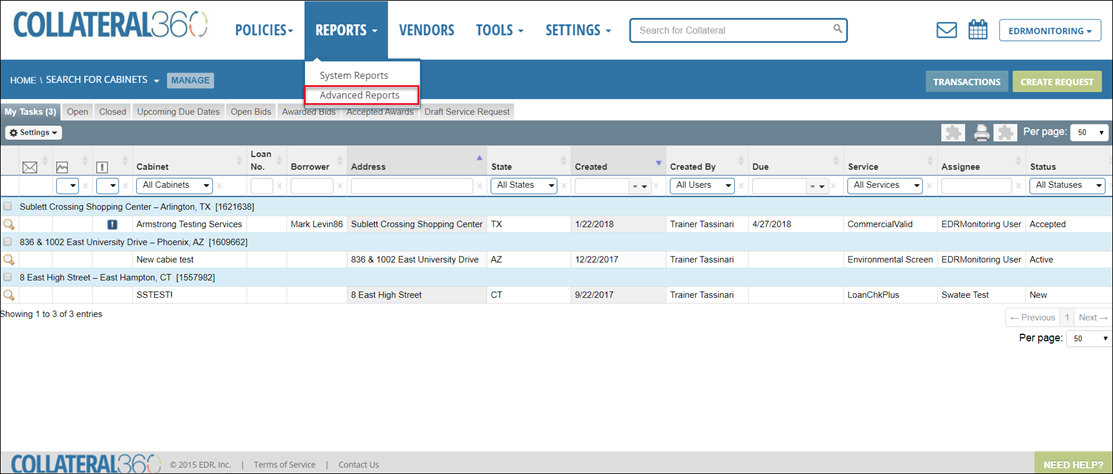
The Advanced Reports page will open.
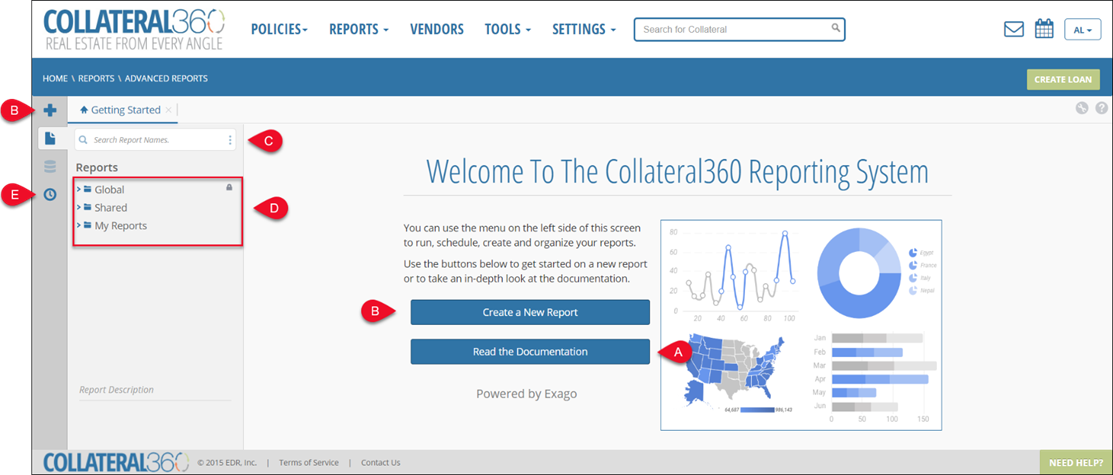
A.Documentation: The Advanced Reports tool includes extensive help documentation. To access it, click Read the Documentation. The documentation can also be accessed on any page by clicking the question mark icon in the upper right corner of the page. The documentation is context sensitive. Example: If you open the help while viewing a report, the Report Viewer documentation page will be displayed by default.
B. Create a New Report: Click the Create New Report button on the home page to begin creating an ExpressView report. Click the icon in the upper left corner of the page to begin creating a report of any type.
C. Search: Search for a report by name. To also search by the description field, click the three dots icon to expose a menu and then click the Include Description checkbox.
D. Folders: There are three primary folders:
Global: Contains pre-defined reports. These reports cannot be edited, but they can be exported or duplicated if they require manipulation.
Shared: Initially empty. This folder contains reports that are shared within a Company.
My Reports: Initially empty. This folder contains reports created by the signed-in user. They are not shared with other users.
E. Scheduler: Schedule reports and manage previously scheduled reports.
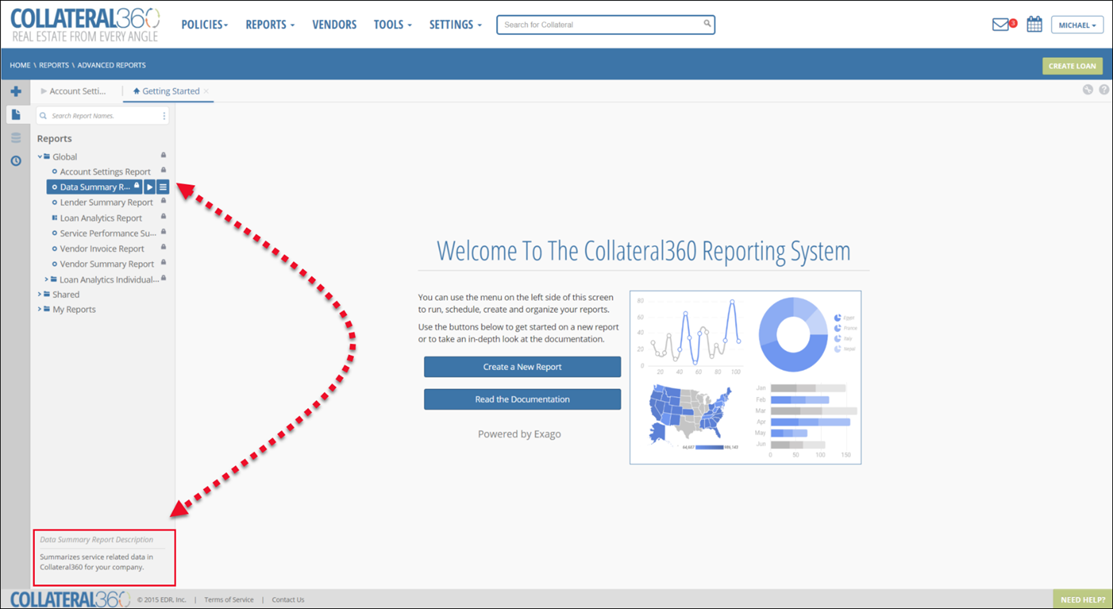
In the lower left-hand corner of the screen a report description provides a summary of the currently selected report.
User Advanced Reports Help
You can access the built-in help documentation from any page within Advanced Reports by clicking the icon in the upper right corner of the screen.
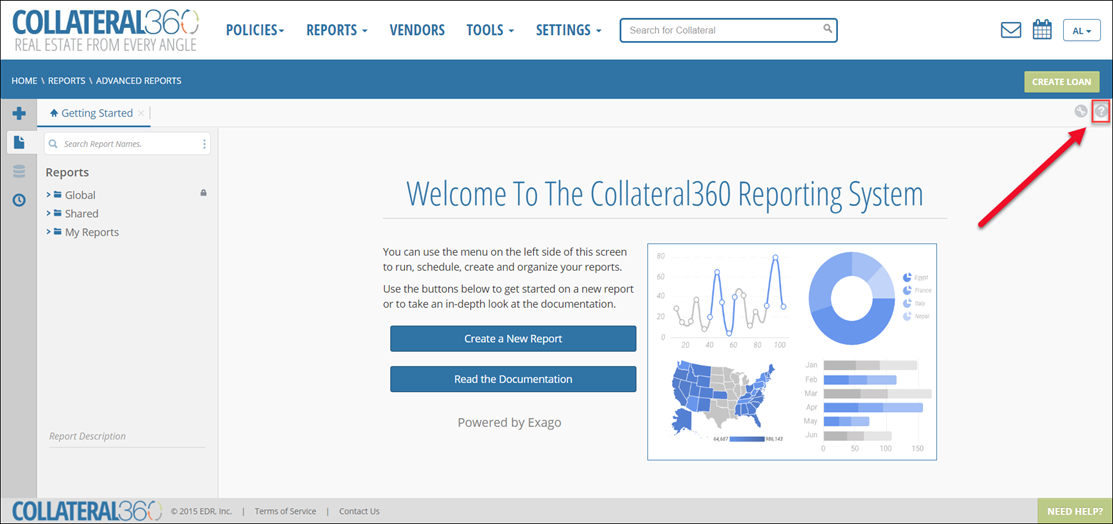
The help documentation is contextual. Example: If you click the help icon while you are building a report using the ExpressView report builder, the documentation will open to the ExpressView section of the documentation.
The help documentation contains three tabs:
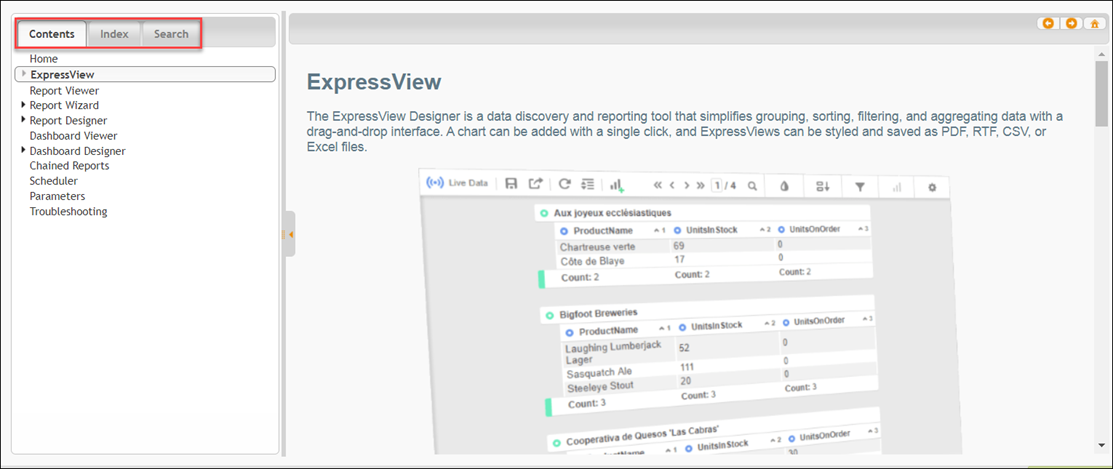
Contents: Browse the table of contents. Click an arrow icon to the left of a section to display the nested topics.
Index: Browse the index of keywords.
Search: Search for a specific topic.
Run Reports
To expose the reports contained in one of the three primary folders, click the folder icon, then click the arrow next to that folder.
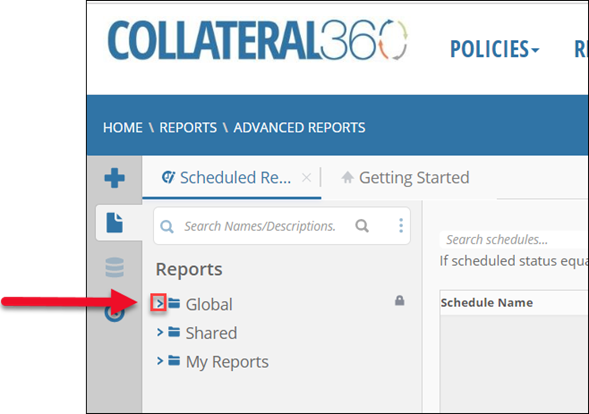
The sub-folders (if any) and reports will be exposed. Click on a report to expose two additional buttons.
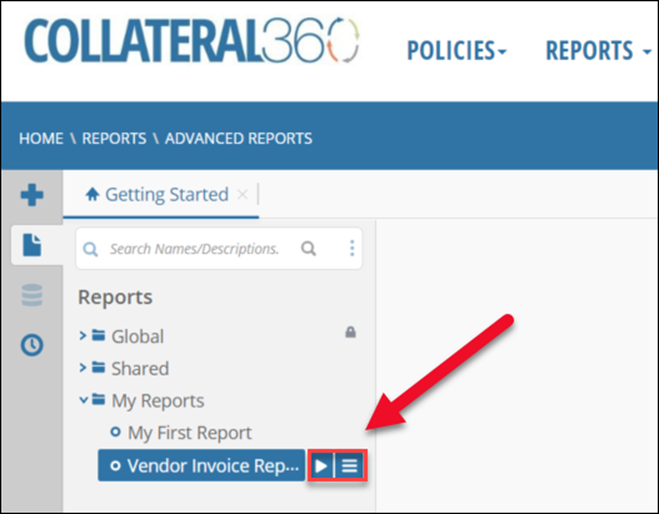
The menu icon reveals a menu of options. For more information, refer to the Manage Reports section below.
The arrow icon will run the report.
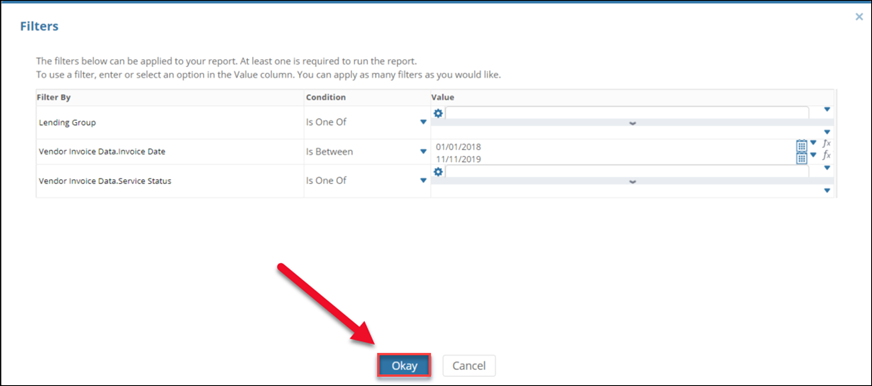
The Filters modal will open. A minimum of one filter or parameter must be set to run any report.
Note:
Some reports have default filters to preserve performance. In some cases, the default filter can be removed; in others, it cannot.
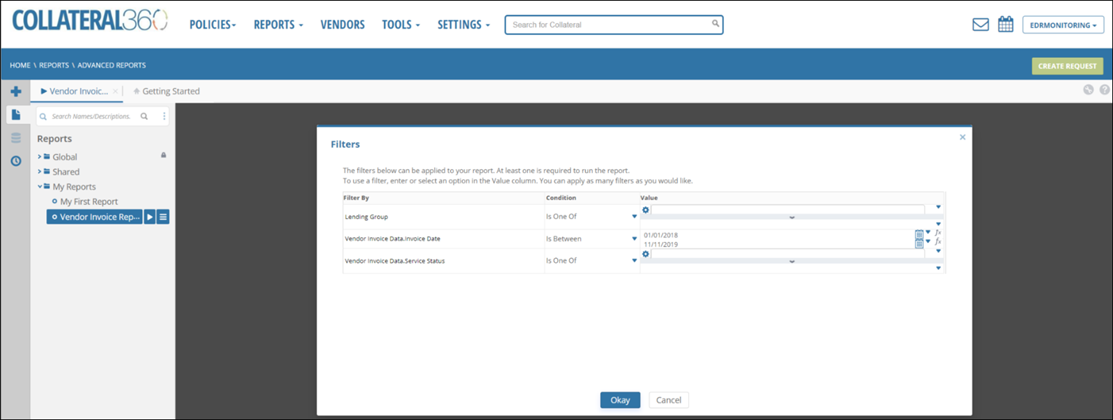
The filters available vary among reports. For more information about filters, refer to the Filters page of the Advanced Reports help documentation.
Once filters have been set, click Okay at the bottom of the Filters modal to apply the filter(s) and run the report.
The report results will be displayed.

A. Report title and date: The title of the report and the date on which it was run. | |
B. Report results: The values returned by the report and limited by the filters selected. | |
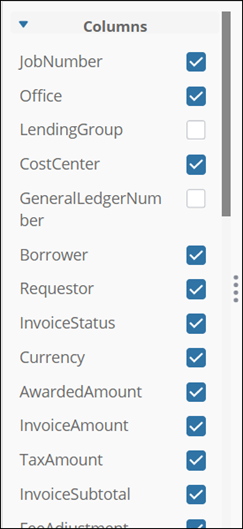
C. Column selector: Click the four dots icon to expose a menu containing all the columns available for the report. Click the checkbox next to an item to add/remove that column from the report. After making the desired changes, click the four dots icon to hide the menu again. |
|
D. Page navigation: If the report results cannot all be displayed on a single page, navigation buttons and page numbers will be visible in the upper right-hand corner of the screen. Click the outer left/right arrows to skip to the first or last page, respectively. Click the inner left/right arrows to skip backward or forward one page at a time. To jump to a specific page, enter the page number in the white box and then press enter on your keyboard. |
|
E. Search: Enter a word or phrase to search the current page of the report results. Instances of the word or phrase entered will be highlighted in the report results. Navigate through the instances of that search phrase by clicking the icons. Instances of the search phrase that appear in portions of the report results that are off screen will be highlighted. |
|
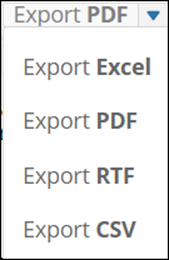
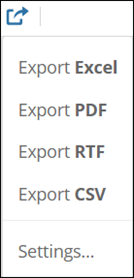
F. Export: Click to expose a menu containing up to four types of file formats in which the report results can be downloaded.
Click a file type. A pop-up will appear and display the progress of the file generation. Once the file has been generated, the pop-up will close, and the file will automatically be downloaded to your computer. |
|
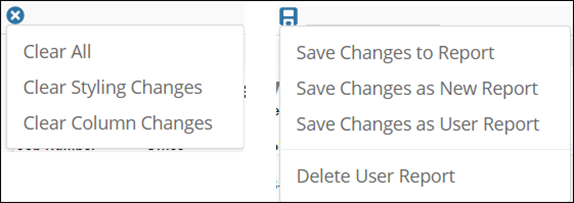
G. Save/delete layout: The styling of a report, such as the font and colors used, can be modified. Click the save (disc) icon to save these changes. You will be presented with up to four options, with locked reports (such as Global Reports) only having two.
Click the delete (X) icon to delete layout changes. Three options will be available:
|
|
Styling can be applied to the report results. Right-click in a cell to expose the styling menu.
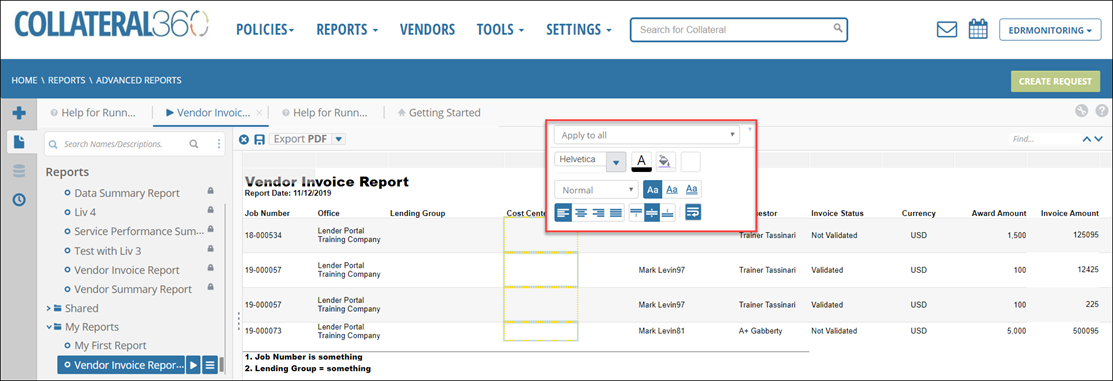
For more information about styling, refer to the Report Viewer page of the Advanced Reports documentation.
Report results can be sorted by column. To sort by column, click on a column header.
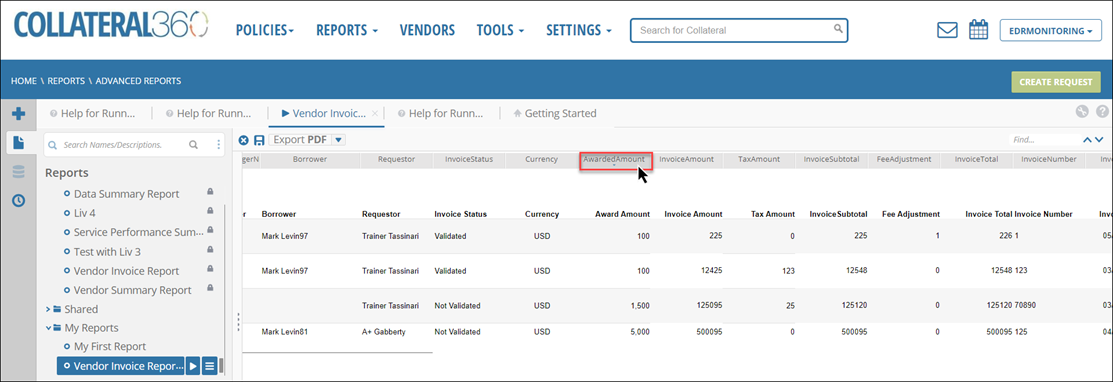
A small blue arrow will appear in the column header to indicate that sorting has been applied. Click again to change the sort order.
A downward facing arrow indicates an ascending sort order.

An upward facing arrow indicates a descending sort order.

Click a third time to clear the column sorting.
Columns can be hidden. Right-click on a column to expose three buttons.
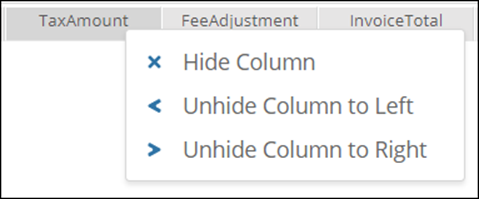
If the column to the left is not hidden, the Unhide Column to the Left button will be grayed out. The same is true for the Unhide Column to the Right button.
Manage Reports
Click the Options menu next to a report to expose a menu of options. The options available will vary, based on the user’s permissions level and the restrictions placed on the report selected.
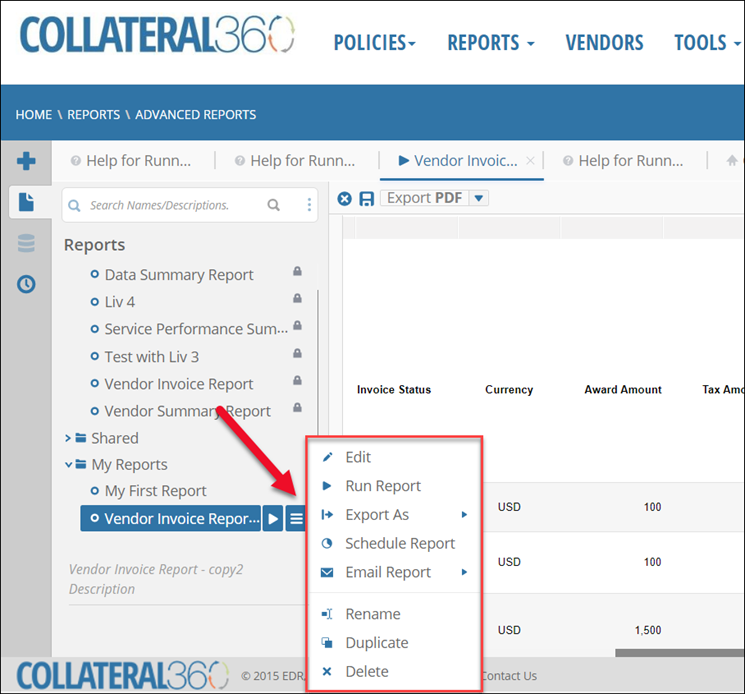
Edit: Click to open the report for editing. Refer to the Report Designer page of the Advanced Reports documentation for more information.
Run Report: Click to run the report. As usual, you will be prompted to select filters before the report runs.
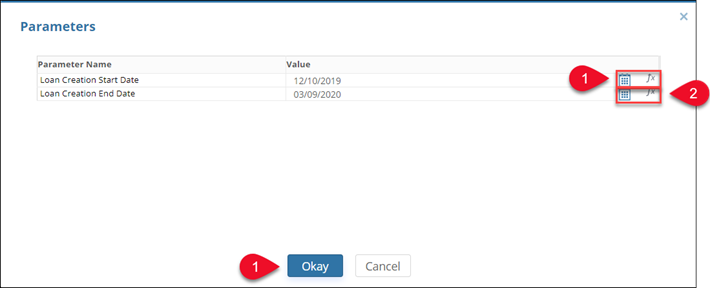
Export As: Exposes a secondary menu that lists the file formats available. Click on a file format to begin exporting the report in that file format. Before the file can be exported, you will be prompted to select parameters.
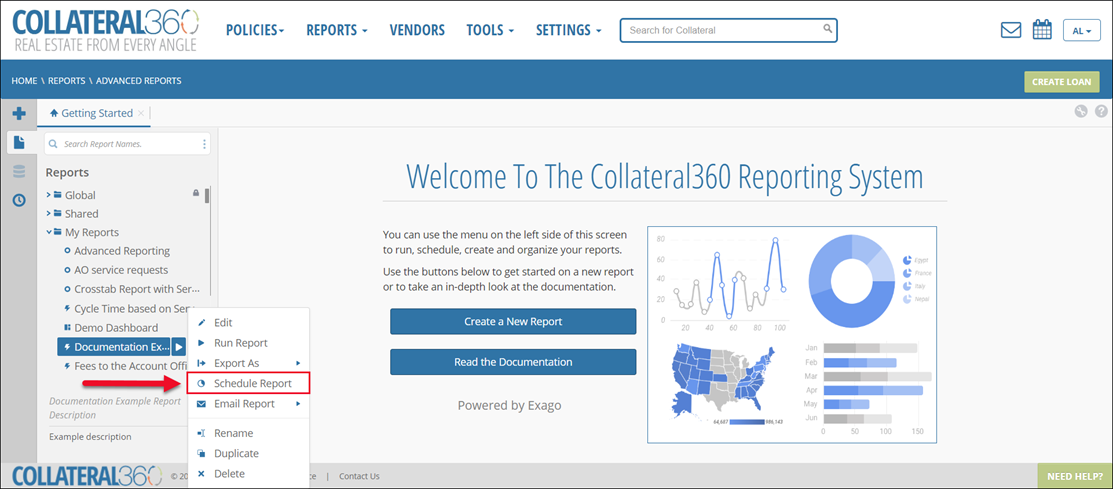
Schedule Report: Click to schedule a report to be run and sent. Refer to Schedule a Report for more information.
Email Report: Click to expose a sub-menu with a field to enter an email address and select a file format. Enter the address of the desired recipient and then select the file format in which the report should be sent. You will be prompted to select parameters. The report will be emailed once the file has been generated.
Rename: Click to open the report name for editing.
Duplicate: Click to create a copy of the report. You will be prompted to enter a report name and select a folder in which to place the report.
Delete: Click to delete the selected report. A pop-up will request confirmation.
Create Reports
To create a new report, click the plus/add icon in the upper left-hand corner of the screen.
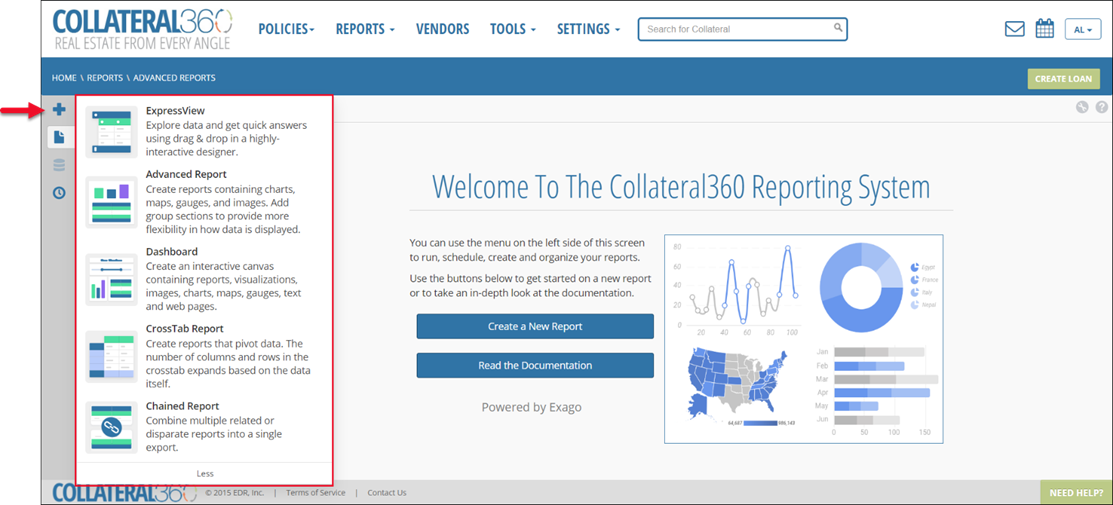
Create a New Report in the center of the home page can also be used, which will open the ExpressView report designer.
There are five report types:
ExpressView: Explore data and get quick answers using drag & drop in a highly-interactive designer.
Advanced Report: Create reports containing charts, maps, gauges, and images. Add group sections to provide more flexibility in how data is displayed. For more information, refer to the Report Designer page of the Advanced Reports help documentation.
Dashboard: Create an interactive canvas containing reports, visualizations, images, charts, maps, gauges, text and web pages. For more information, refer to the Dashboard Designer page of the Advanced Reports help documentation.
CrossTab Report: Create reports that pivot data. The number of columns and rows in the crosstab expands based on the data itself. For more information, refer to the Report Wizard page of the Advanced Reports help documentation.
Chained Report: Combine multiple related or disparate reports into a single export. For more information, refer to the Chained Reports page of the Advanced Reports help documentation.
ExpressView
ExpressView allows you to quickly and easily build a report. When you open the ExpressView Designer, a tutorial modal will open. Click Learn How to proceed through the tutorial.
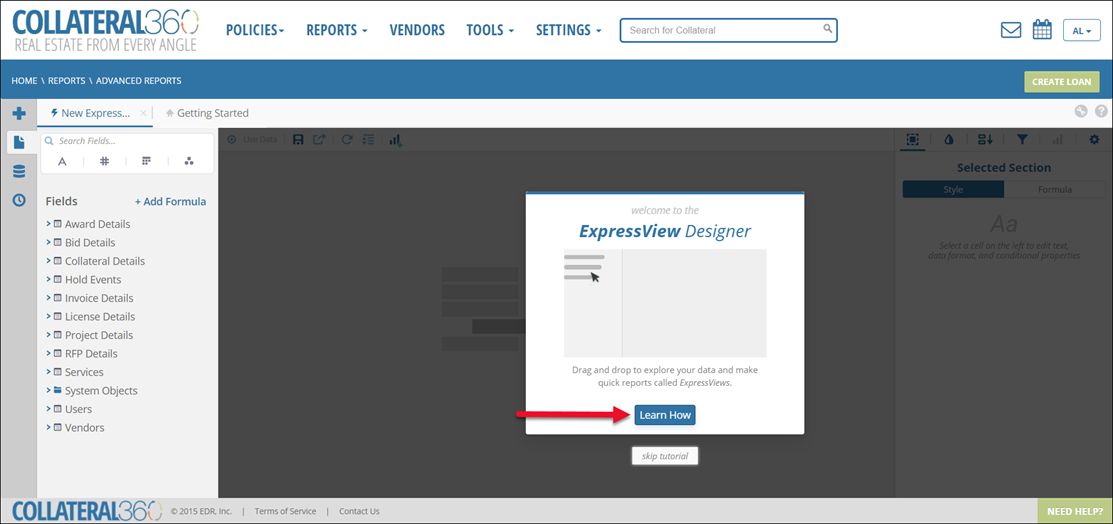
Click skip tutorial to skip the tutorial. You will be asked whether you also want to disable hints. Make the desired selection(s) and then click Skip Tutorial.
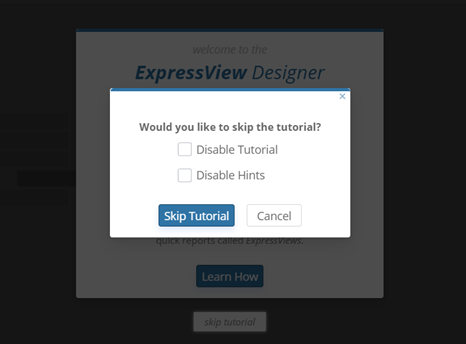
Note
You can change these settings at any point by clicking the "wrench" icon in the upper right corner of the screen.
ExpressView uses drag-and-drop fields to build a report. The fields are organized based on their location and function within Collateral360. Example: Collateral Details includes City, Country, Assessor’s Parcel Number, etc.
Click on a Field category (e.g. Award Details or Bid Details) to expose the nested fields.
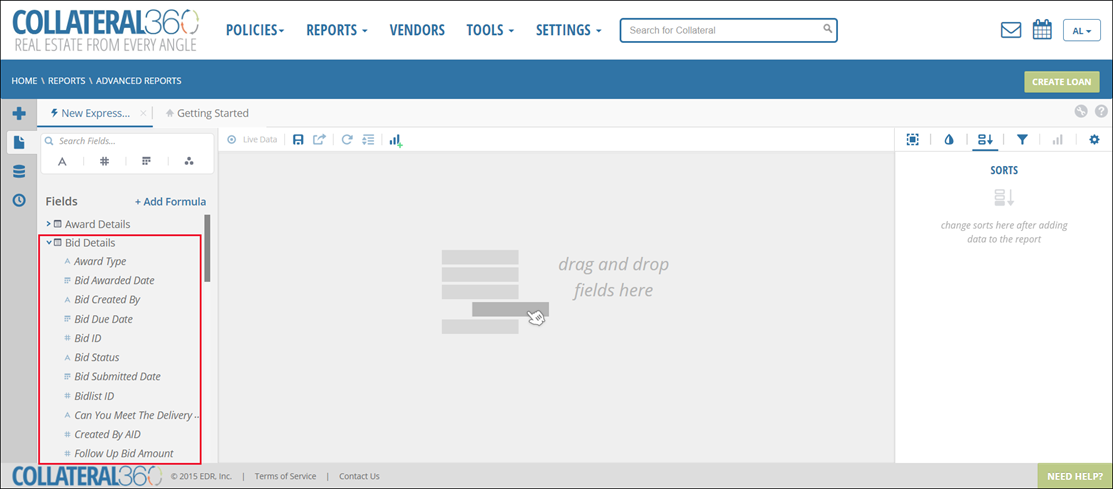
In the example above, the Bid Details fields have been exposed.
Add a field to the report by dragging and dropping it in the desired location in the report, which will add the field to the report as a column. You can also add a field by clicking the arrow icon next to the field name, which will add the field to the right side of the report.
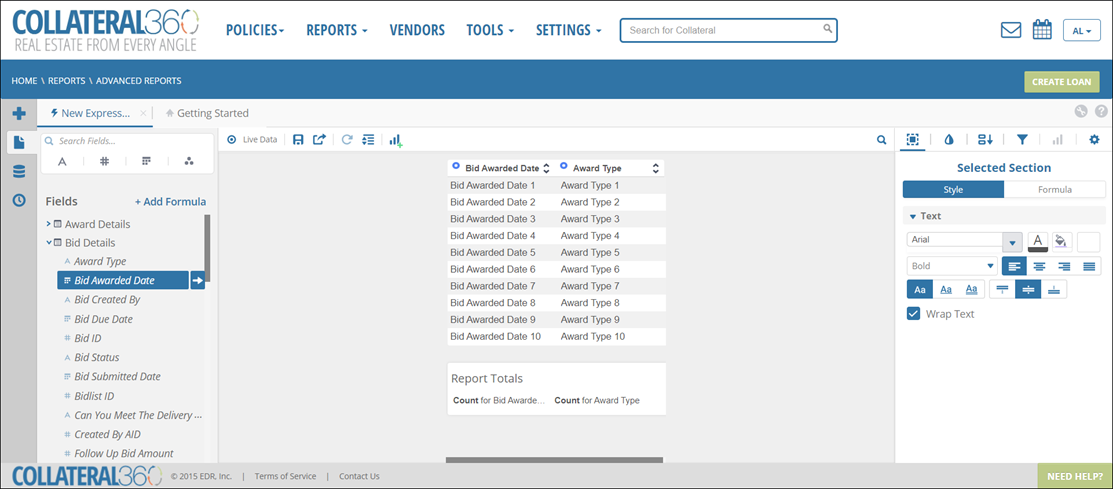
In the example above, two fields have been added to the report: Bid Awarded Date and Award Type.
To move a field once it has been added to the report, click on the column header and drag and drop the field into the desired location.
Right click on a column or column heading to expose two menus that allow you to format and manipulate the column or column heading selected.
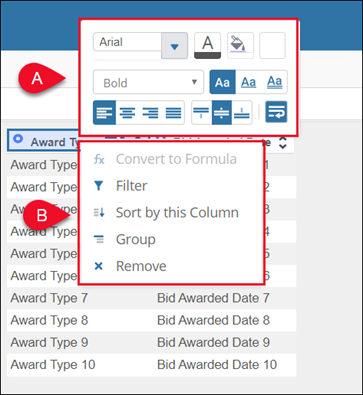
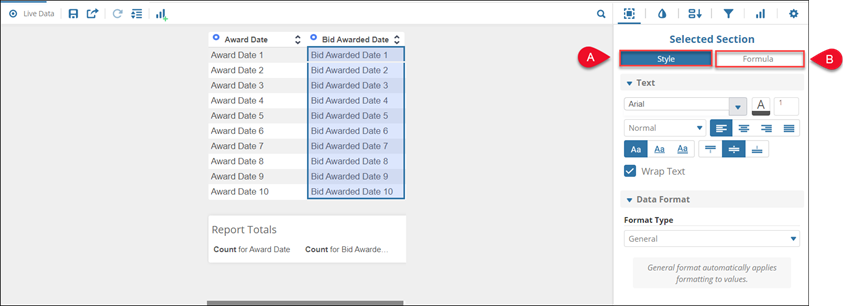
A. The top menu allows you to control the appearance of the column or column heading. It includes common formatting controls, such as vertical and horizontal alignment, font, and background color.
B. The lower menu includes controls for arranging and manipulating the data in the column.
Convert to Formula | Opens a menu to add formulas, which allow you to do calculations, make calculations, insert images, and more. |
Filter | Adds the selected column as a filter on the report; values must be entered in the right-hand menu for the filter to be successful. |
Sort by this Column | Sort the report by this column. Click the up and down icons at the top of the column to change the sort direction.
|
Group | Collect a set of data rows, based on a common value, into a column called a group column. |
Remove | Remove the column from the report. |
Click on the circle/radial icon in a column header to display the Radial Menu.
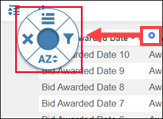
The Radial Menu contains four buttons:
| Group: Collect a set of data rows, based on a common value, into a column called a group column. |
| Filter: Adds the selected column as a filter on the report; values must be entered in the right-hand menu for the filter to be successful. For more information about filters, refer to the Filters section in the Advanced Reports Help. |
| Sort: Sort the report by this column. Click the up and down icons at the top of the column to change the sort direction.
|
| Remove: Remove the column from the report. |
The navigation bar above the report contains two sets of buttons.
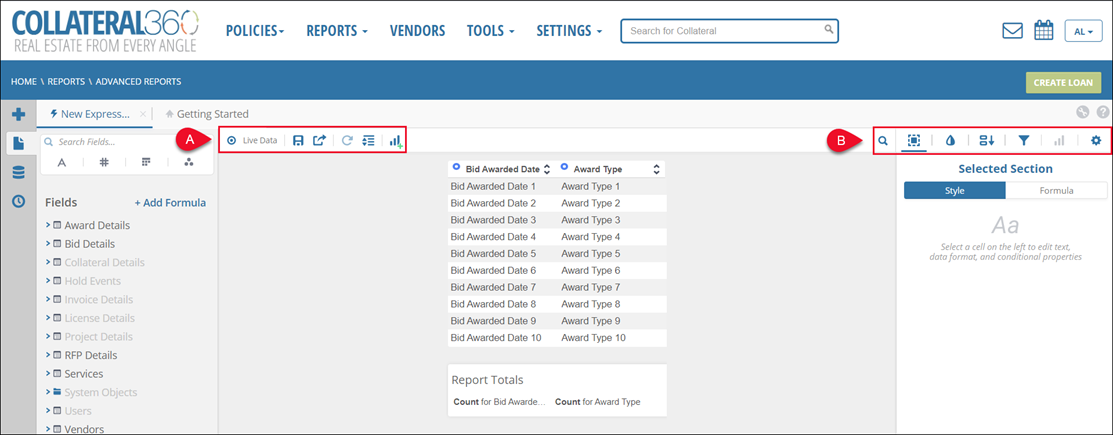
A. The set of buttons on the left includes the following:
| By default, your report will not be populated with live data. You can build and edit a report more quickly with live data disabled. When you are ready to display live data, click Live Data. If you have not yet applied at least one filter, you will be required to do so before live data can be turned on. When Live Data is enabled, some menu buttons will become grayed out. Note: Live data is delayed by one hour. |
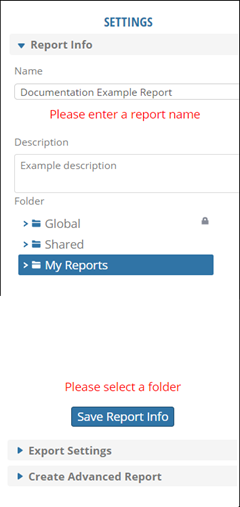
| Click to save the report. The Settings menu will open to the right of the report table. Enter a Name and Description and select a report folder (Shared or My Reports). Click Save Report Info to save the report.
Note: Reports in the Shared folder are visible to everyone in your company. Reports in the My Reports folder are visible only to you. |
| Click to expand the menu of export options, then click a file format.
The Parameters modal will open.
|
| Click to refresh the report data. When Live Data is turned off, this button will be grayed out. |
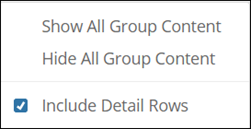
| Click to display a menu that controls grouping options.
|
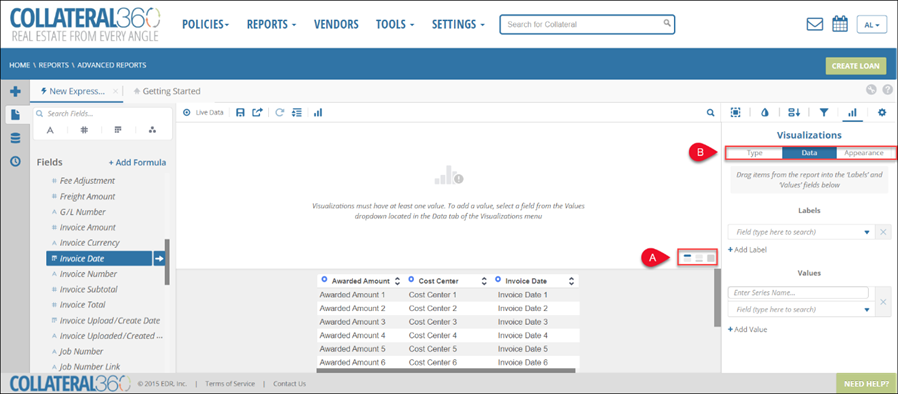
| Click to display the Visualization pane. When Live Data is disabled, the Visualization menu will also appear to the right of the Visualization pane.
A. The "view" buttons define whether the visualization is above the report table, below the report table, or covers the entire report table area.
B.The Visualization menu contains three tabs:
|
| Click to expose the search menu.
Note: If Live Data is disabled, you will search the placeholder text (e.g. “Award Date 2”), rather than actual report data. |
| Click to open the Selected Section menu. B. Click the Formula tab to display a menu of formulas. For more information about formulas, refer to the Formulas page in the Advanced Reports Help |
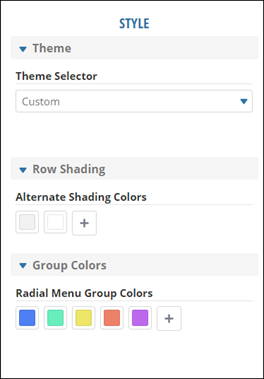
| Click to open the Report Formatting and Style menu. Selections made here apply to the entire report. |
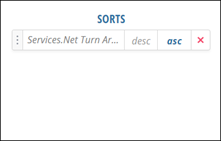
| Click to open the Sorts menu. If you’ve sorted one or more columns using the arrows in the column headers, those sorts will appear here. You can manage and delete the sorts using this menu.
|
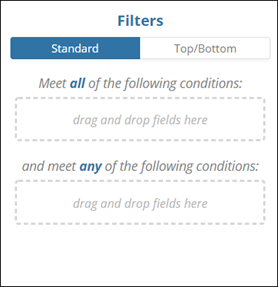
| Click to open the Filters menu.
For more information about filters, refer to the Filters section in the Advanced Reports Help. |
| Click to show Visualization menu. The Visualization menu contains three tabs:
For more information, refer to the Visualizations section of the Advanced Reports help. |
| Click to open the Settings menu. The Settings menu contains three tabs:
|
Schedule a Report
Reports in the Global, Shared, and My Reports folders can be scheduled to run at a specific time. Scheduled report results can be exported and then emailed to the selected individual(s) OR sent to the Scheduled Report Warehouse, where they can be manually downloaded.
The Advanced Reports Scheduler and Advanced Reports Scheduler Email features are enabled/disabled at the company level. As such, your company’s Advanced Reports environment may be structured in one of three ways:
If the Advanced Reports Scheduler feature is not enabled, the Schedule Report button and associated functionality described below will not appear.
If the Advanced Reports Scheduler feature is enabled, but the Advanced Reports Scheduler Email is not, you will have the ability to schedule a report, but not email it. When the scheduled report runs it will go directly to the Scheduled Report Warehouse with no option to email.
If both the Schedule Report Feature and email functionality are enabled, you will have the ability to schedule a report and then define whether it is emailed to users or not. If it is not emailed, it will automatically be sent to the Scheduled Report Warehouse.
To schedule a report, click on the folder icon containing the report. Then click the icon next to the report you would like to schedule. Click Schedule Report.
The Schedule Report wizard has two or three tabs, which are designed to be progressed through in order. If the Advanced Reports Scheduler Email feature is not enabled the Recipients tab will not appear.
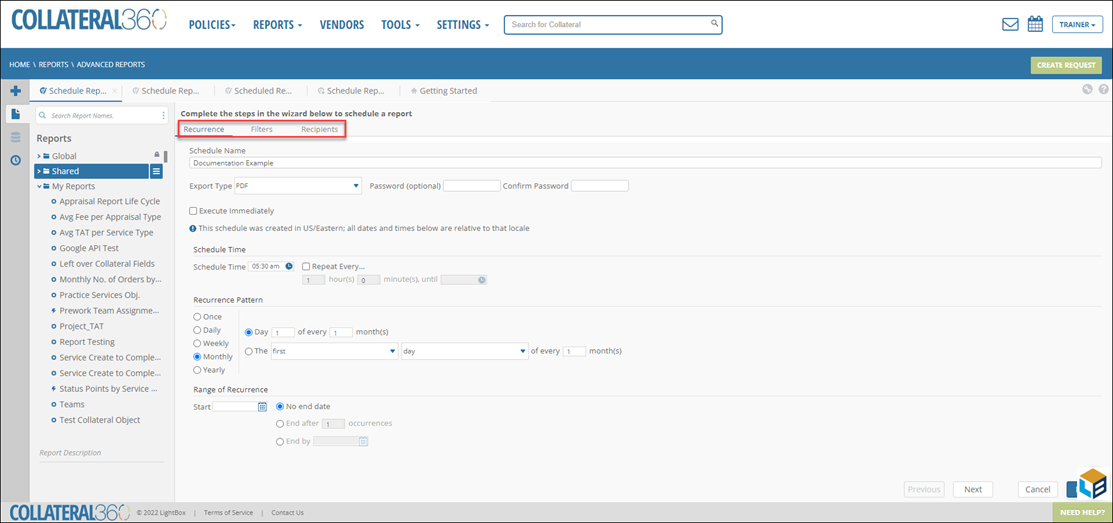
Recurrence
Enter a name for the schedule. Optionally, set a password that will be required to access the file.
Select the export file type.
Define when the scheduled report is run. Note that all times are Eastern Standard Time.
Filters
Apply a minimum of one filter. Report default filters will already be applied.
Recipients (when applicable)
If sending the report to the Scheduled Report Warehouse, leave the Email Results box at the top of the tab unchecked, else;
Enter one or more recipients in the To, Cc, and Bcc fields.
Enter a Subject and body text explaining the purpose of the scheduled report.
To manage scheduled reports, click the "clock" icon in the menu on the left.
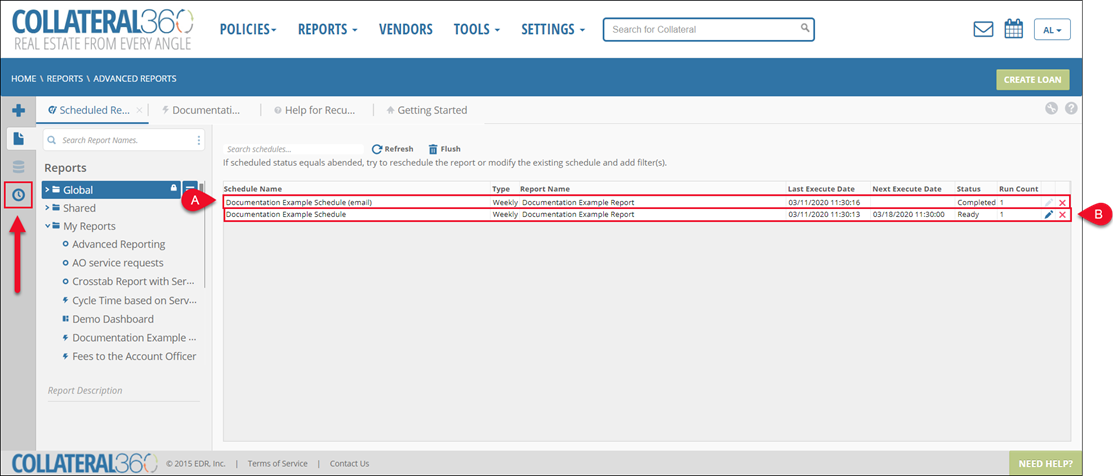
In the example above, there are two scheduled report entries: one indicates a scheduled report that was executed (A) and one that indicates a repeating scheduled event (B).
A. When a scheduled report has run, it creates an entry listing the Schedule Name, Type, Report Name, Last Execute Date, Next Execute Date, Status, and run Count. Click the "X" icon to delete the entry.
B. An entry listing a scheduled report that has not yet run will include the Schedule Name, Type, Report Name, Last Execute Date, Next Execute Date, Status, and run Count.
Click the X icon to delete the entry. Click the pencil icon to open the scheduled report wizard and make edits.
For more information about scheduling reports, refer to the Scheduler page of the Advanced Reports help documentation. For information about accessing and managing the Scheduled Report Warehouse, refer to the Scheduled Report Warehouse Job Aid.
Access Pre-defined Reports
Advanced Reports includes several pre-built reports, which are found in the Global Reports section.
All Current Assignments by Status:
This report will display all statuses except for Cancelled and Completed and show how many Services are in each status.
Each status can be expanded to show the Primary Assignee and number of Jobs in that status assigned to each person.
Each Primary Assignee can be expanded to show the details of the Job and contains a link to navigate to each Job on a separate tab.
Completed Service Summary by Primary Assignee:
This report will be displayed first by Primary Assignee and show the Median Net Turn Around in Business Day and the total number of Jobs Completed.
Then, by the number of Services completed each year by that Assignee with the total Median Turn Time in Business Days.
Each year can be expanded to show the month and then to show the Service Type.
Each Service time can be expanded to show Job and property specific information, including the Start, Due Complete Dates, and Gross and Net Turnaround times.
Data Summary Report: The Data Summary Report (DSR) provides the following information for each service:
Transaction Data
Collateral Information
Assignee’s
Service Type
Service Status
Fees
Vendor Information
Service Score
Reports on external, internal, and third-party services.
Detailed Completed Service by Month:
This report will display the complete Services, first by year, showing the number of Projects, number of Services, and Median Net Turn Time.
Then it will show the same information by Month.
Next it will display the number of Services and type of services by Primary Assignee and details for each Service.
Service Performance Summary: Designed to address the individual time slices related to a service. Each time slice includes the # of days on hold, the gross and net turn time. Time Slices include the following:
Service Create to Assign
Assignment to RFP or Direct Award
Out to Bid to Pending Authorization (measure the responsiveness of the Account Officer)
Authorization to Award
Assigned to Awarded to a Vendor
Vendor Award to Accept (measure the responsiveness of the engaged vendor)
Vendor accept to First Upload of Final Report
First Upload of Final Report to Review Complete
In Review to Service Complete
Service Create to Complete
Reports on external, internal, and third-party services.
Vendor Invoice: Displays a list of service-related invoices that have come from the vendor through the Invoice Validation modal. Included in the report is the service information, certain transaction information (lending group, cost center, general ledger), invoice status, awarded and invoiced amount, vendor and collateral information.
This report helps identify outstanding invoices that have not yet been validated and passed along to invoice management.
Does not report on third-party services.
Vendor Summary Report: The Vendor Summary Report displays information about the engaged vendor for a particular assignment. Quickly see the relationship between a vendor, the collateral, the service and their performance in terms of bid analytics.
Account Settings Report: The Account Settings Report displays information related to a company’s internal users, including their last login date to track Collateral360 access.
Loan Analytics Report: The Loan Analytics Report is a breakdown of all loans by location, type, property type, and service type. It is designed as a dashboard to display all 4 reports on one page, at one time, however they can be run individually if a user chooses to do so. This is the new version of the Loan Analytics report that exists in the Collateral360 System Reports. Reports on external, internal, and third-party services.
Reports on external, internal, and third-party services.
Lender Summary Report: The Lender Summary Report is intended to be used to track Account Officer activity. It contains AO names, service details, fees, key service dates, and vendor information.
On Hold Dates convey the most recent hold event and the following status points: On Hold, On Hold - Pending Approval, Incomplete Data, and Resubmitted.
Service Creation Date date filter is required for performance/joins.
Reports on external, internal, and third-party services.
.png)
















.png)